


 Be The Investor Research
Portfolio Diversification, Position Sizing and Risk: A Practical Guide

Learn to measure overlapping exposures, stress a portfolio, calculate conditional position sizes and set review rules using transparent hypothetical examples.
Portfolio risk depends on what can hurt the investments together and how much capital is exposed when that happens. A list of promising securities is not yet a risk plan. Position size, overlapping holdings, liquidity, currency and the timing of cash needs all affect the outcome.
This guide turns those considerations into a practical review: map economic exposures, calculate concentration, stress the portfolio, set conditional position limits, and define monitoring actions. Every numerical portfolio below is hypothetical and deliberately simplified. The weights are teaching inputs, not a recommended allocation or a description of any real fund.
- 1. Define the risk you are trying to manage
- 2. Map economic exposures, not just account labels
- 3. Measure concentration without confusing it with total risk
- 4. Build a portfolio stress test
- 5. Size positions from explicit constraints
- 6. Treat volatility, drawdown and currency as different lenses
- 7. Plan liquidity and distinguish orders from protection
- 8. Rebalance through a written policy
- Practice with issuer documents: map VTI's role
- A practical portfolio-review record
- Frequently asked questions
1. Define the risk you are trying to manage
Start with the portfolio's purpose, time horizon, reporting currency and foreseeable withdrawals. The SEC's asset-allocation guidance connects investment mix with time horizon and risk tolerance. A drawdown that is financially survivable for one objective can be unacceptable for money needed on a fixed date.
Separate three questions. What temporary decline would create an unacceptable decision pressure? What permanent loss would compromise the objective? What liquidity is needed even if markets are unfavorable? These questions cannot be answered by a single volatility number.
Write the exposure you intend to retain, such as long-term equity participation or a specific business thesis, alongside the risks you intend to limit. Otherwise a hedge or an impulsive sale can remove the reason for holding the investment while adding costs. A risk rule should explain what it protects and what remains exposed.
2. Map economic exposures, not just account labels
Combine relevant accounts in one dated inventory. For each position, record market value, instrument type, underlying issuer or benchmark, sector, major business drivers, currency exposure and trading constraints. Add known fund holdings on a look-through basis. Keep unknown exposures marked as unknown instead of treating them as zero.
There are several layers of overlap. Two companies may share a customer spending cycle. A broad equity fund and a sector fund may own the same large companies. A foreign-listed business can earn much of its revenue elsewhere. Classification helps organize the review, but the underlying economic drivers determine which positions may deteriorate together.
FINRA's concentration-risk guidance emphasizes checking inside funds and accounting for exposures that grow as prices change. Use issuer holdings files and company filings rather than assuming that different tickers represent independent risks.
For the mechanics of calculating company exposure through multiple funds, see How to Choose and Compare ETFs. Repeat that calculation for sector and theme exposures when the classification is supportable, while documenting judgment calls.
3. Measure concentration without confusing it with total risk
Start with the largest position, the largest underlying issuer after look-through, and the largest common economic exposure. Then calculate a concentration statistic if it helps compare portfolios.
For nonnegative position weights normalized to sum to 100% at a consistent level of aggregation, one simple measure is the sum of squared weights. With weights expressed as decimals, concentration equals w1² + w2² + … + wn². Its reciprocal gives an effective number of equally weighted positions. These are arithmetic measures of position concentration; they do not measure correlation, leverage or security quality.
| Hypothetical weights | Sum of squared weights | Effective position count |
|---|---|---|
| 25%, 25%, 25%, 25% | 4 × 0.25² = 0.25 | 1 ÷ 0.25 = 4.00 |
| 70%, 10%, 10%, 10% | 0.70² + 3 × 0.10² = 0.52 | 1 ÷ 0.52 ≈ 1.92 |
The second portfolio has four lines but much greater concentration. Conversely, four equal positions tied to the same industry shock can still behave like one large economic bet. Do not use the effective count as a certification of diversification.
4. Build a portfolio stress test
A stress test asks what happens under a specified set of returns. It does not assign a probability or claim to identify the worst possible outcome. Use scenarios tied to identifiable drivers, such as weaker demand, tighter financing, an adverse currency move, or a company-specific failure. State the time window and which assumptions move together.
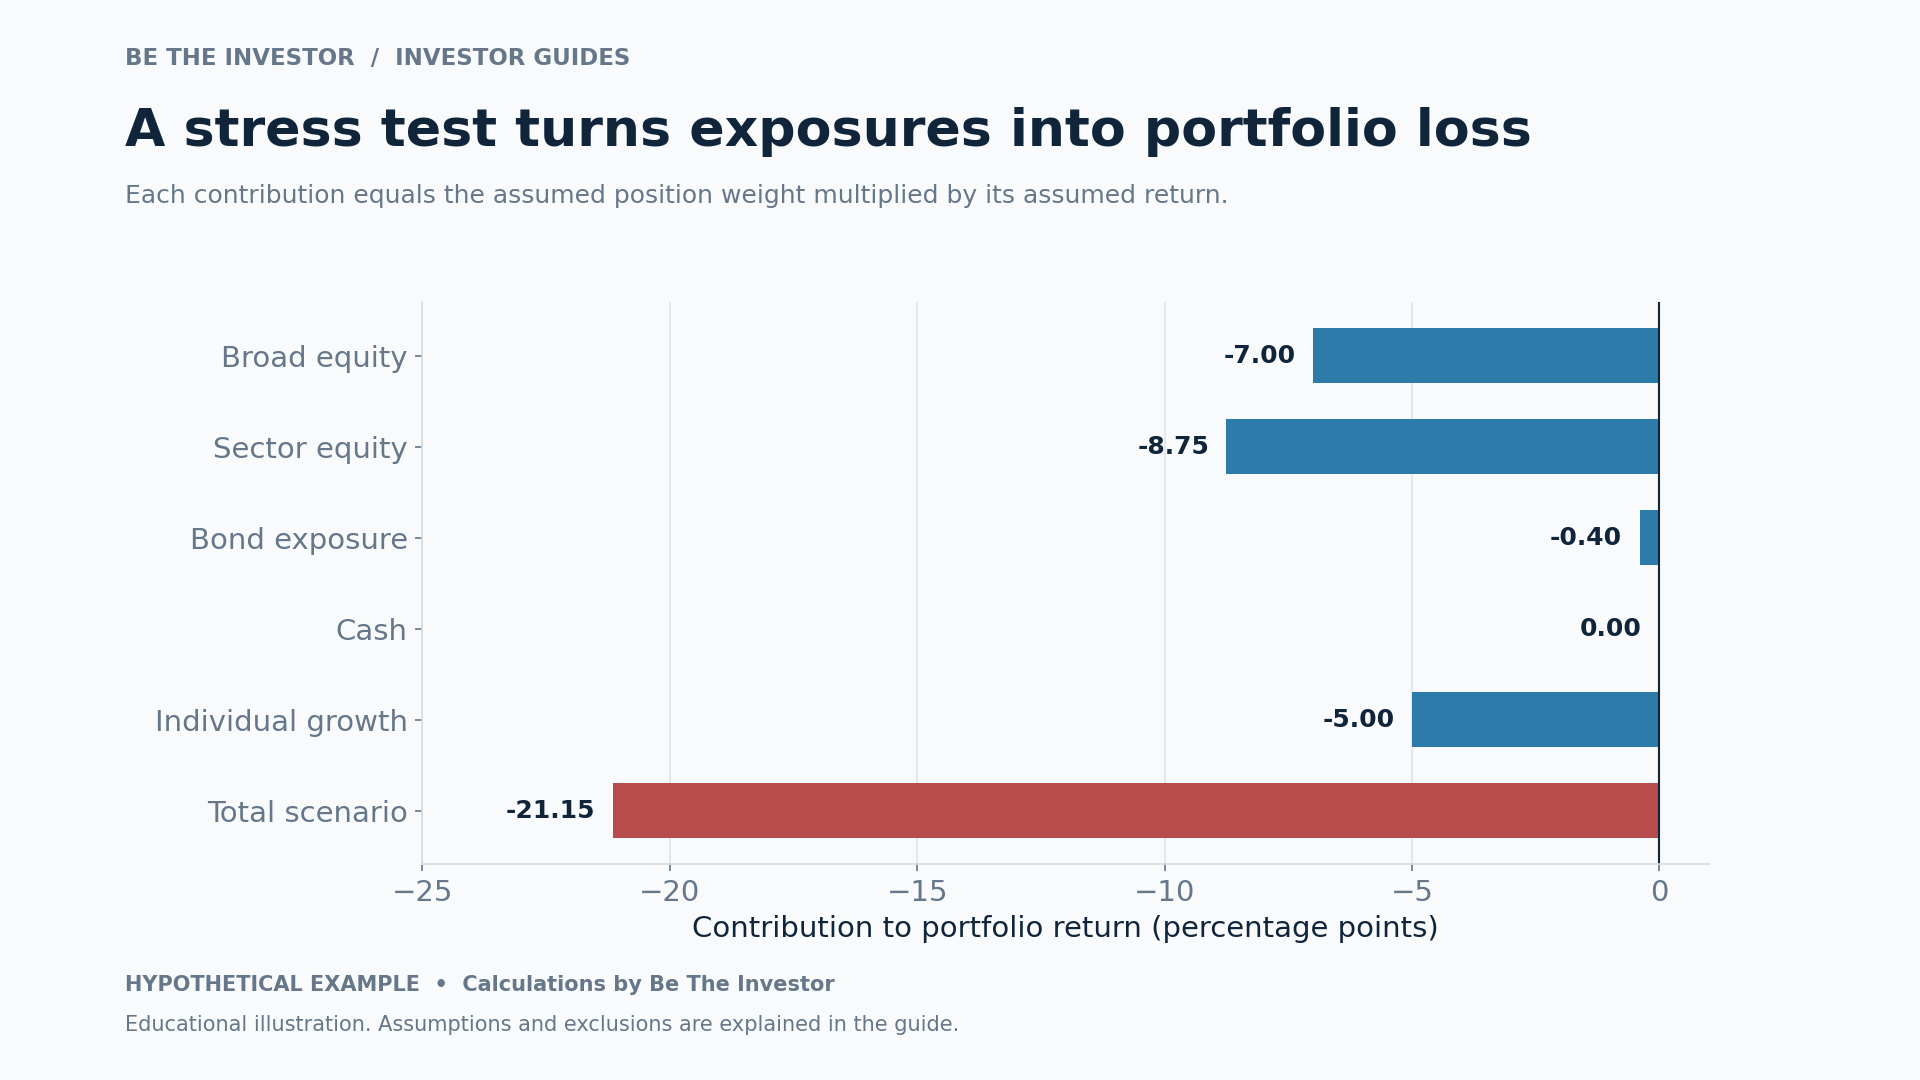
For a portfolio with no contributions, withdrawals or rebalancing during the test, scenario return is the sum of each starting position weight multiplied by its assumed return. The following fictional $100,000 portfolio illustrates the calculation. The positions represent separate dollar holdings; no actual ETF holdings or current market forecasts are assumed.
| Position | Starting weight | Assumed scenario return | Portfolio contribution |
|---|---|---|---|
| Broad equity fund | 35% | −20% | −7.00 percentage points |
| Sector equity fund | 25% | −35% | −8.75 percentage points |
| Bond fund | 20% | −2% | −0.40 percentage points |
| Cash | 10% | 0% | 0.00 percentage points |
| Individual growth stock | 10% | −50% | −5.00 percentage points |
| Total | 100% | Illustrative combined shock | −21.15% |
The calculated loss is $21,150, leaving $78,850. Fees, taxes, cash interest and trading costs are excluded. The bond and cash assumptions are modeling choices, not promises of defensive performance. Different shocks could produce larger losses or change which position contributes most.
The useful next step is to identify the largest loss contributors and ask whether that exposure is intentional. Adding another security with the same driver may not improve the scenario. Reducing a concentrated holding or changing the underlying exposure can be more direct than adding complexity.
5. Size positions from explicit constraints
A scenario loss budget converts an assumed adverse return into a conditional position size:
Position value = allowed loss in the stated scenario ÷ assumed adverse return magnitude.
Hypothetical example: a $100,000 portfolio permits a $1,000 loss from one new position under an assumed 40% decline. The resulting position is $1,000 ÷ 0.40 = $2,500, or 2.5% of the portfolio.
That is not an absolute loss cap. If the investment instead falls 70%, the same holding loses $1,750, or 1.75% of the original portfolio. If an unleveraged long position becomes worthless, the $2,500 investment is lost. The initial stress assumption determines the sizing result; changing it changes the answer.
Next apply other constraints. Suppose, solely for illustration, an investor-defined issuer limit is 3% and existing funds already provide 1% exposure to that issuer. Remaining capacity is 2%, so the concentration rule is tighter than the 2.5% scenario calculation. Liquidity or uncertainty could justify an even smaller position. Limits define ceilings, not targets.
Document why the adverse scenario is credible, what would make it worse, and what evidence would support increasing or reducing exposure. A high-conviction narrative is not a substitute for a plausible downside case. Use BTI's investment-thesis guide to connect position reviews to business evidence.
6. Treat volatility, drawdown and currency as different lenses
Volatility describes variation in returns. Drawdown measures the fall from a previous portfolio peak. Neither alone describes a permanent business loss or the ability to meet a cash obligation. Historical statistics depend on the observation period and can change when conditions change.
The recovery calculation is asymmetric. In a hypothetical example, a portfolio falling from 100 to 80 loses 20%. Returning from 80 to 100 requires a 25% gain. More generally, recovering a loss fraction d requires d ÷ (1 − d). This is arithmetic, not a forecast about recovery time.
Also measure returns in the currency of the objective. SEC guidance on international investing explains that exchange-rate changes can alter translated returns.
Hypothetical currency calculation: an asset rises 10% in its trading currency while that currency falls 8% against the investor's reporting currency. With no hedge, income, costs or other changes, the translated return is 1.10 × 0.92 − 1 = 1.2%. Adding 10% and minus 8% would miss the interaction. Do not count the same currency effect twice when combining scenarios.
7. Plan liquidity and distinguish orders from protection
Ask how you would reduce exposure when conditions are difficult. Inspect quote depth, spreads, relevant trading hours and potential market closures. A position that looks modest by portfolio weight can still be hard to exit efficiently.
A stop order does not guarantee the trigger price: it becomes a market order when triggered. A stop-limit order constrains acceptable execution prices but can remain unfilled. The SEC's stop-order bulletin explains the distinction. Do not justify a large position by assuming an adverse overnight gap will stop at a chosen price.
If considering a hedge, identify the exact exposure it offsets, the cost, the holding period and the risk that the hedge and portfolio behave differently. That mismatch is basis risk. Compare the hedge with simply reducing the position. A hedge that tracks a broad index may leave an individual company's business risk largely intact.
Leverage adds another constraint. The SEC's leveraged-investing bulletin explains how borrowing and leveraged instruments can magnify losses. Cash invested is not always the same as economic exposure.
8. Rebalance through a written policy
Rebalancing brings an allocation back toward its chosen mix. It addresses drift; it does not establish that the original mix remains appropriate. First check whether the goal or investment evidence has changed.
A policy can use scheduled reviews, thresholds, or a combination. Define the rule before a difficult market period, along with the treatment of taxes, transaction costs and new contributions. Vanguard's rebalancing guide discusses these approaches and the use of portfolio cash flows.
A falling price alone does not prove that adding is appropriate. If the business thesis has deteriorated, mechanically restoring the original weight can increase exposure to a worsening investment. Likewise, a rising weight deserves a risk review even when the business remains strong.
Practice with issuer documents: map VTI's role
Open Vanguard's current VTI issuer page. Record the stated mandate and the dates of its holdings and risk disclosures. Then describe what this equity exposure would add to a fictional portfolio and what risks would remain elsewhere in that portfolio.
This exercise does not assume any current company weights. Download a dated holdings file before calculating overlap. The five-position stress test above does not represent VTI or its actual holdings. The purpose is to practice connecting a real fund's documents with a transparent portfolio calculation.
A practical portfolio-review record
- Objective: purpose, time horizon, reporting currency and liquidity requirements.
- Exposures: largest issuers, overlapping funds, economic drivers and unknowns.
- Stress: scenario assumptions, position contributions and total loss.
- Constraints: scenario budget, concentration capacity and liquidity limits.
- Actions: what evidence would lead to adding, reducing, exiting or reviewing a hedge.
- Review: next scheduled date and events that require an earlier assessment.
Frequently asked questions
How many holdings make a portfolio diversified?
There is no universal count. Weights, overlapping issuers and common economic drivers matter. A fund can contain many securities while remaining concentrated in one market or factor.
Is a scenario loss budget a guaranteed maximum loss?
No. It limits modeled loss under specified assumptions. Larger price moves, gaps, leverage and execution costs can produce a different result.
Can diversification prevent all losses?
No. It can reduce dependence on particular investments, but broad market shocks can affect multiple holdings simultaneously. Test the combined portfolio rather than relying on labels.
Should every drawdown trigger a sale?
A useful rule distinguishes price movement, changed business evidence, exceeded risk constraints and changed cash needs. The action follows the reason for the review, not the percentage decline alone.
Educational material. Scenarios and limits are illustrative assumptions, not forecasts, recommended portfolio weights or personalized investment advice.
Continue your investor learning path
Use the investor guides learning path to choose your next topic and connect this research step with your investment plan.
Sources and further reading
Primary research sources checked on November 6, 2026. Open the original documents again before making a decision based on information that may change.
Cover photograph: Photo by Cristhian David Duarte on Pexels. Used under the Pexels License.
Continue your VTI research
Frequently asked questions
What is "Portfolio Diversification, Position Sizing and Risk: A Practical Guide" about?
Build a portfolio risk review using exposure mapping, stress tests, position sizing and rebalancing. Includes worked examples and a practical checklist.
Which stocks and assets does this article cover?
This article relates to VTI.
What is the market context?
Portfolio risk depends on what can hurt the investments together and how much capital is exposed when that happens. A list of promising securities is not yet a risk plan. Position size, overlapping holdings, liquidity, currency and the timing of cash needs all affect the outcome. This guide turns those considerations into a practical review: map economic exposures, calculate concentration, stress…
When was this article published?
It was published on 06 / 11 / 2026 by Be The Investor Research.