


 Be The Investor Research
How to Build and Track an Investment Thesis

Build a testable stock investment thesis, connect operating drivers to valuation, and track confirming and conflicting evidence with a reusable template.
An investment thesis is a testable explanation of how a company's future results could create value for shareholders at the price being considered. It connects business evidence to financial assumptions, valuation, and conditions that would invalidate the original reasoning. A useful thesis also tells you what to check after the purchase.
This guide provides a practical research method and a reusable tracking template. All numerical scenarios, companies, prices, and monitoring thresholds in the worked examples are hypothetical. NVIDIA appears only in a separate exercise on locating real source documents.
- 1. Write a claim that can fail
- 2. Keep facts, forecasts, and judgments separate
- 3. Explain what you think the price requires
- 4. Turn the thesis into a small set of measurable pillars
- 5. Connect the business story to a valuation calculation
- 6. Maintain an evidence ledger after each material event
- 7. Separate the business, the stock, and the position
- 8. Use this investment-thesis template
- Practice with a live filing
- Frequently asked questions
1. Write a claim that can fail
Start with a sentence that names the operating change, the mechanism, the time horizon, and the evidence that could contradict it. Statements such as “this company has a large market” are incomplete because a large opportunity does not tell you which company captures value or what shareholders already pay for that opportunity.
Illustrative thesis: Over the next reporting year, a fictional manufacturer could grow sales by converting repeat orders into deliveries and improve operating margin through better capacity utilization. The thesis weakens if orders fail to convert, customer losses persist, or maintaining output requires materially more capital than the model assumes.
The sentence is a research hypothesis, not an established fact. Expand it into a short explanation of why customers buy, why competitors cannot easily remove the expected profit, and why the improvement reaches each share after financing costs and dilution.
Use the fundamental stock-research guide to establish the business analysis before building a tracking system around it.
2. Keep facts, forecasts, and judgments separate
Create four labels in your research notes:
- Reported fact: a historical figure or disclosed event with a document and date.
- Management expectation: guidance, a target, or a claim about the future.
- Analytical assumption: your forecast of volumes, pricing, margins, capital requirements, or dilution.
- Investment judgment: your interpretation of the evidence and whether the security offers sufficient prospective compensation for risk.
A management target does not become a reported fact because it appears in an official presentation. A calculation is reproducible only when its inputs and assumptions are visible.
Obtain original filings through the SEC's EDGAR research resources. Record the reporting period separately from the publication date. A fresh article about an old filing does not make the underlying operating information current.
Keep the original version of the thesis. Append new evidence rather than rewriting the starting argument after each result. Otherwise, a failed forecast can quietly disappear from the record and leave you unable to assess your process.
3. Explain what you think the price requires
A company can perform well while its shares offer an unattractive outcome from a demanding starting valuation. Your thesis therefore needs two questions: what will the business deliver, and how much of that outcome is already reflected in the security's price?
Use dated analyst estimates when you have a reliable source, but do not equate consensus with a complete description of market expectations. Separate published estimates from your model and from assumptions inferred through valuation. A reverse valuation asks which growth or profitability assumptions would justify the observed price under a specified model; it does not reveal every investor's private forecast.
The SEC cautions against relying solely on analyst recommendations. The research task is to test the assumptions, not count favorable ratings. If you cannot establish a credible expectations benchmark, label that gap and limit claims that the market is overlooking something.
Write a concrete difference: you expect faster conversion of orders, a more persistent margin change, or less dilution than the documented benchmark. Then identify what public evidence could show that difference. An unsupported claim of superior insight is not an analytical advantage.
4. Turn the thesis into a small set of measurable pillars
Choose a few drivers that materially affect the financial result. For each one, record the baseline, your expected path, the relevant source, and a reason to reopen the analysis. More metrics do not necessarily improve the decision if none connects to value.
Hypothetical monitoring example: the following thresholds are draft exercise rules for a fictional manufacturer. They are not recommended trading triggers or universal standards of investment quality.
| Pillar | Starting assumption | Next-year expectation | Review trigger |
|---|---|---|---|
| Customer demand | Annual revenue of $900 million | Annual revenue of $1,000 million | Annual revenue below $950 million, or loss of a customer essential to the forecast |
| Operating economics | Operating margin of 13% | Operating margin of 15% | Margin remains below 13% after checking temporary costs and reporting changes |
| Shareholder participation | 50 million diluted shares assumed | 50 million diluted shares assumed | Diluted share forecast exceeds 52 million without enough offsetting value creation |
A review trigger starts an investigation. It should not mechanically decide a trade. A delayed delivery may affect timing, whereas a permanent customer loss may change the economics. Document why you classify the event as temporary or structural and what evidence supports that distinction.
Preserve metric definitions. The SEC's guidance on operating metrics discusses definitions, calculation methods, and material methodology changes. If management changes a retention or order metric, investigate comparability before connecting the old and new series.
5. Connect the business story to a valuation calculation
Hypothetical base-case calculation: assume next-year revenue of $1,000 million, a 15% operating margin, $30 million of net interest expense, a 25% effective tax rate, and 50 million diluted shares. Assume no preferred dividends or other adjustments to income available to common shareholders.
- Operating income = $1,000 million × 15% = $150 million.
- Pretax income = $150 million − $30 million = $120 million.
- Net income = $120 million × (1 − 25%) = $90 million.
- Diluted EPS = $90 million / 50 million = $1.80.
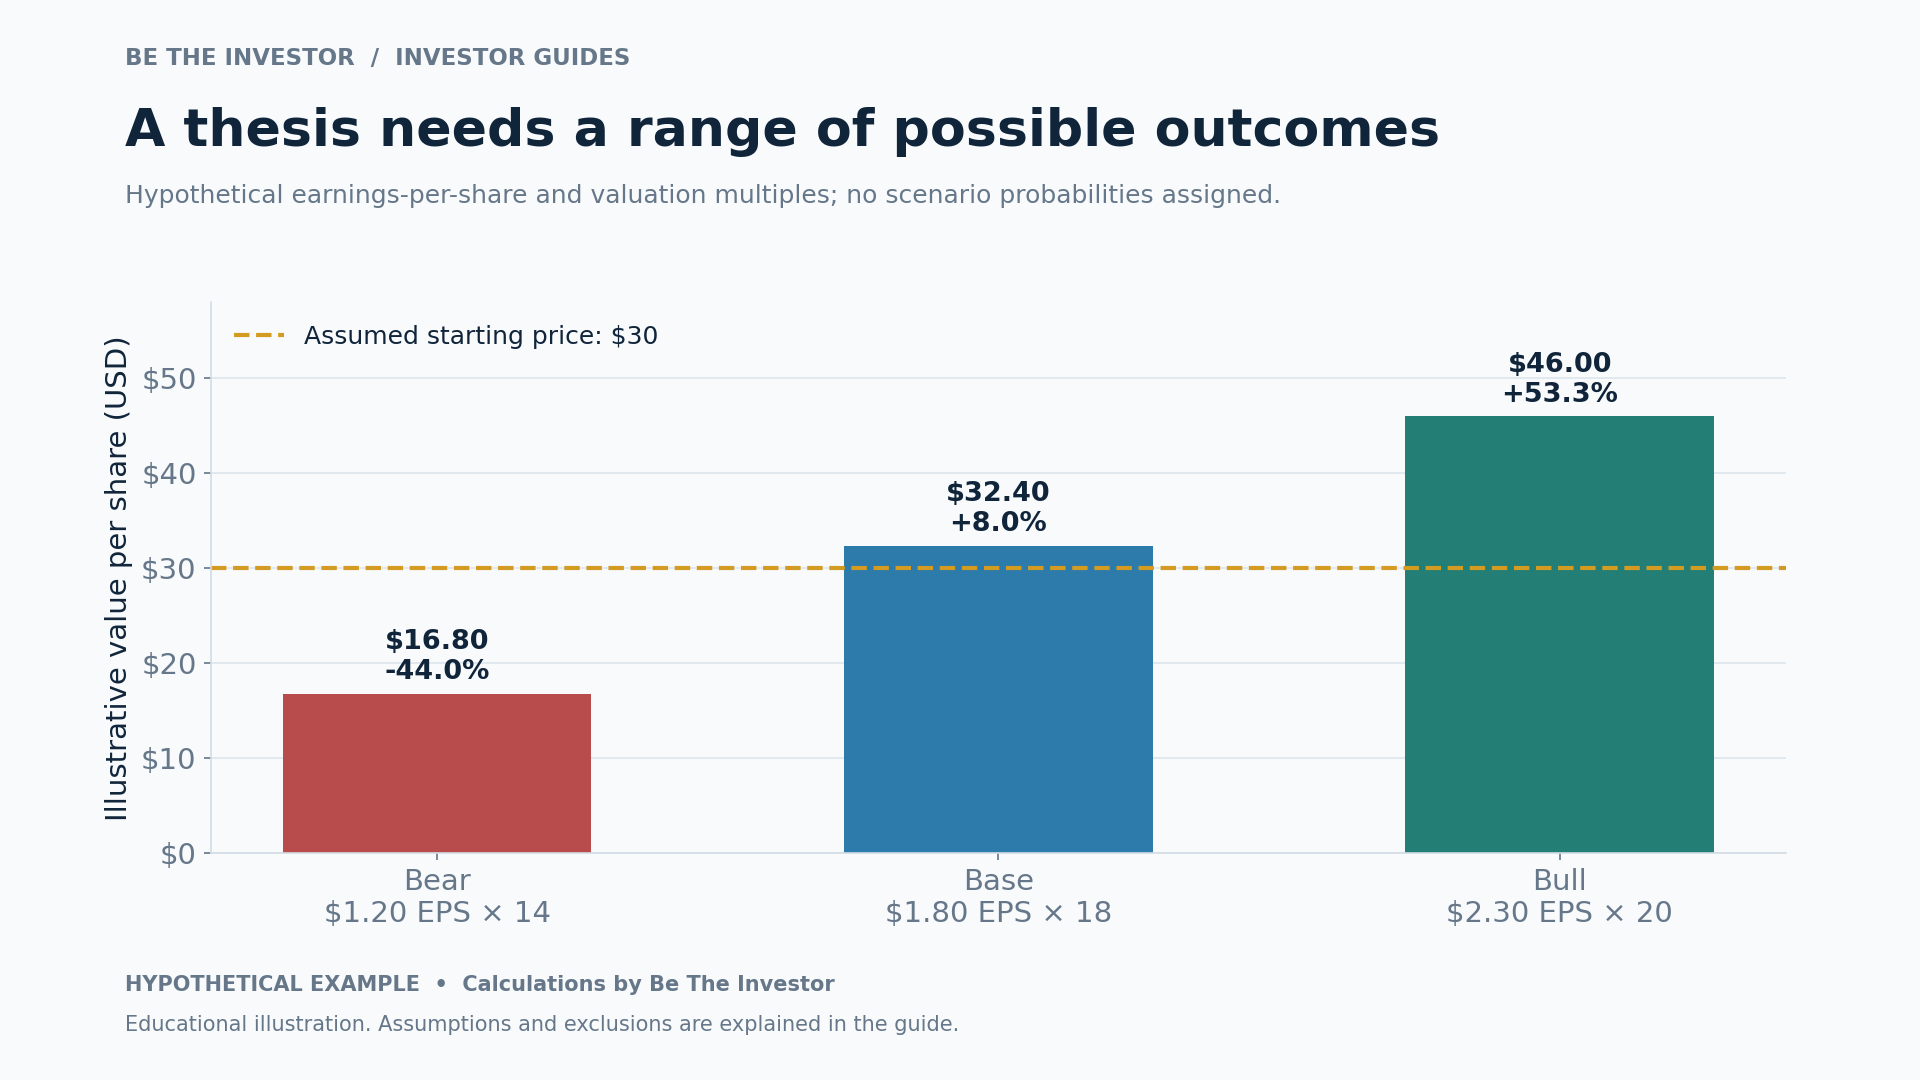
- Illustrative future value at an assumed 18-times earnings multiple = $1.80 × 18 = $32.40 per share.
At an assumed starting price of $30, that future value implies an 8.0% price change over the model horizon, before dividends, fees, and taxes. The multiple is an analytical assumption. It needs a rationale based on growth, durability, risk, and comparable valuation; it is not established by the calculation itself.
Now test alternative assumptions. The following bear and bull earnings inputs are independent hypothetical scenarios; they are not probabilities or confidence intervals.
| Scenario | Assumed EPS | Assumed multiple | Illustrative value | Change from $30 |
|---|---|---|---|---|
| Bear | $1.20 | 14 times | $16.80 | −44.0% |
| Base | $1.80 | 18 times | $32.40 | +8.0% |
| Bull | $2.30 | 20 times | $46.00 | +53.3% |
This exercise reveals how strongly the result depends on both earnings and valuation. It does not establish an expected return because no defensible scenario probabilities have been supplied. Follow the valuation guide for a broader treatment of cash-flow models and valuation ranges.
6. Maintain an evidence ledger after each material event
Give each thesis pillar a stable name and keep an append-only record with these fields: event date, source publication date, source link, reported evidence, affected pillar, comparison with your prior expectation, model change, interpretation, and next review point.
A useful entry explains a consequence. “Management sounded confident” is weak evidence. “The disclosed order conversion fell below the assumption in the revenue forecast; the next-year sales estimate requires revision unless delivery timing explains the gap” links the observation to the model. Preserve management's explanation separately from the evidence that verifies it.
Revisit the thesis after earnings and when a material development affects its central assumptions. Current reports can disclose events between scheduled financial statements, as described in Investor.gov's guide to Form 8-K. A review schedule should also specify what you will do when a required source is missing: keep the issue unresolved, rather than assume a favorable answer.
Use qualitative status labels such as strengthening, intact, under review, impaired, or retired. Explain the evidence behind the label. An invented confidence score can conceal judgment without making it more accurate.
7. Separate the business, the stock, and the position
Separate hypothetical example: you initially forecast EPS of $2.00 and assume a 20-times multiple, producing a value of $40 against a $35 price. The implied price upside is 14.3%. Later, the EPS forecast improves to $2.20, but the share price rises to $55. With the same assumed multiple, estimated value becomes $44, which is 20.0% below that new price.
The earnings outlook improved while the valuation comparison became less attractive. Neither number establishes what the stock will do next. They show why confirming the business thesis is insufficient to confirm the investment case at every price.
A third decision concerns portfolio exposure. A reasonable company thesis does not determine an appropriate position size. FINRA's concentration-risk guidance explains that overlapping sector and fund holdings can amplify exposure. Review portfolio concentration separately from conviction in the company.
8. Use this investment-thesis template
- Security and horizon: issuer, share class, exchange, currency, and review horizon.
- Thesis sentence: the operating mechanism that could create shareholder value.
- Evidence: dated primary sources and the most important missing information.
- Expectations: documented guidance or consensus, plus separately labeled model assumptions.
- Pillars: baseline, expected path, metric definition, source, and review trigger.
- Valuation: explicit forecasts, financing and dilution assumptions, and alternative scenarios.
- Opposing case: the strongest explanation for why your forecast could fail.
- Decision log: what changed, what remains unresolved, and the next evidence required.
Write the opposing case in terms an informed skeptic would accept. Identify evidence you would find uncomfortable. If every possible outcome can be explained as good news, the thesis is no longer testable.
Practice with a live filing
Use NVIDIA's official annual-report archive to practice extracting a business description, principal risks, and the financial inputs needed for a thesis. NVIDIA's financial-reports page identifies its Nasdaq ticker as NVDA. Select a dated report, record a disclosed operating fact, and write a separate forecast that could be tested against a later filing. This exercise teaches source navigation; it makes no recommendation about NVIDIA and none of the fictional scenarios in this guide describes it.
Frequently asked questions
How is a thesis different from a price target?
A target is an output of assumptions and a valuation method. A thesis explains the mechanism behind those assumptions and the evidence that could invalidate them. A target without that explanation is difficult to monitor.
Does a falling share price mean the thesis is broken?
No. A price move is a reason to investigate. Compare operating evidence, changed assumptions, financing needs, valuation, and wider market conditions. Price alone cannot establish which part of the original reasoning failed.
When should I replace the original thesis?
When the reason for owning the security changes materially, record a new thesis and preserve the old one. Do not silently replace failed growth expectations with an unrelated rationale merely to defend an existing position.
What if I cannot obtain reliable consensus estimates?
Work with company guidance, historical disclosures, and explicitly labeled assumptions. You can still analyze the business, but you should not claim a quantified disagreement with consensus that you have not verified.
Educational research methodology. Example thresholds and valuations are hypothetical decision aids, not investment recommendations.
Continue your investor learning path
Use the investor guides learning path to choose your next topic and connect this research step with your investment plan.
Sources and further reading
Primary research sources checked on November 6, 2026. Open the original documents again before making a decision based on information that may change.
Cover photograph: Photo by Winston Lim on Pexels. Used under the Pexels License.
Continue your NVDA research
Frequently asked questions
What is "How to Build and Track an Investment Thesis" about?
Build an investment thesis with measurable drivers, valuation scenarios, evidence logs, and review triggers. Includes a practical template and worked examples.
Which stocks and assets does this article cover?
This article relates to NVDA.
What is the market context?
An investment thesis is a testable explanation of how a company's future results could create value for shareholders at the price being considered. It connects business evidence to financial assumptions, valuation, and conditions that would invalidate the original reasoning. A useful thesis also tells you what to check after the purchase. This guide provides a practical research method and a…
When was this article published?
It was published on 06 / 11 / 2026 by Be The Investor Research.