


 Be The Investor Research
How to Choose and Compare ETFs: Holdings, Costs and Risk

A practical ETF due-diligence process covering mandates, holdings overlap, expense ratios, spreads, tracking, liquidity, currency exposure and issuer documents.
An exchange-traded fund can hold many securities and still be a poor fit for a portfolio. The useful comparison starts with the exposure you need, then tests how faithfully and efficiently each fund delivers it. A low expense ratio cannot compensate for buying the wrong market, taking unwanted concentration, or misunderstanding a product's structure.
This guide develops a repeatable ETF research process: define the portfolio job, inspect the mandate and holdings, calculate ownership costs, examine trading conditions, and write a decision you can revisit. All funds, companies, prices, weights and returns in the worked examples are hypothetical. The separate Vanguard document exercise uses a real issuer source without recommending its fund.
- 1. Define the portfolio job before choosing a ticker
- 2. Verify what the product actually is
- 3. Inspect the index rules and actual holdings
- 4. Separate ongoing costs from trading costs
- 5. Check tracking on a consistent basis
- 6. Examine liquidity and execution
- 7. Review currency, domicile and distributions
- 8. Practice with issuer documents: Vanguard's VTI fund
- A reusable ETF comparison sheet
- Common mistakes to catch before investing
- Frequently asked questions
- Continue the learning path
1. Define the portfolio job before choosing a ticker
Write one sentence describing the exposure you want and what it should add. Examples include broad domestic equity exposure, exposure to companies outside your home market, or a deliberately limited sector allocation. These jobs require different comparisons. A narrow technology fund is not a substitute for a broad equity fund merely because both have performed well.
Next, record the intended holding period, the currency in which you measure wealth, and the amount you may need to withdraw. Separate a long-term allocation from a tactical position. A portfolio role should survive a period of weak performance; otherwise the selection may simply reflect recent returns.
Create a shortlist of funds with comparable mandates. Match the benchmark, geographic scope, investment style, share class and currency-hedging policy before comparing costs. If the mandates differ, describe the exposure tradeoff first. A cheaper fund tracking a different index is a different investment decision.
2. Verify what the product actually is
Read the investment objective, principal strategies and principal risks in the issuer's current prospectus. Determine whether management tracks an index, follows an active strategy, uses derivatives, or targets a daily leveraged result. An index fund still has investment risk and can diverge from its benchmark, as the SEC's index-fund guide explains.
Also verify the legal wrapper. Exchange-traded products include structures with materially different risks. An exchange-traded note is an issuer's unsecured debt obligation, rather than ownership in a pooled portfolio. FINRA's product overview explains why the structure affects investor protections, costs and tax treatment. A familiar ticker suffix or the word “fund” is insufficient evidence.
For a daily leveraged or inverse objective, switch to the guide to leveraged and inverse ETFs. Ordinary long-term fund comparisons do not capture daily-reset behavior.
3. Inspect the index rules and actual holdings
An index name is only the beginning. Ask how securities qualify, how weights are assigned, when rebalancing occurs, and whether limits constrain individual companies or sectors. A market-capitalization-weighted basket and an equal-weighted basket can hold similar companies while producing different exposures. Selection rules based on dividends, earnings or volatility create another set of choices. Review the methodology instead of inferring the strategy from its marketing label.
Download the issuer's holdings file and record its date. Check the largest positions, sector and country concentrations, and securities you already own elsewhere. A large count of holdings does not tell you whether a handful of companies dominate the portfolio. For funds using derivatives, inspect economic exposure as well as the accounting holdings list; collateral holdings alone may not describe the intended risk.
Compare the latest portfolio with the stated mandate. An active manager may change exposures, while an index provider may revise eligibility rules. Historical returns describe an earlier portfolio and market environment. They do not establish that the current version will behave identically.
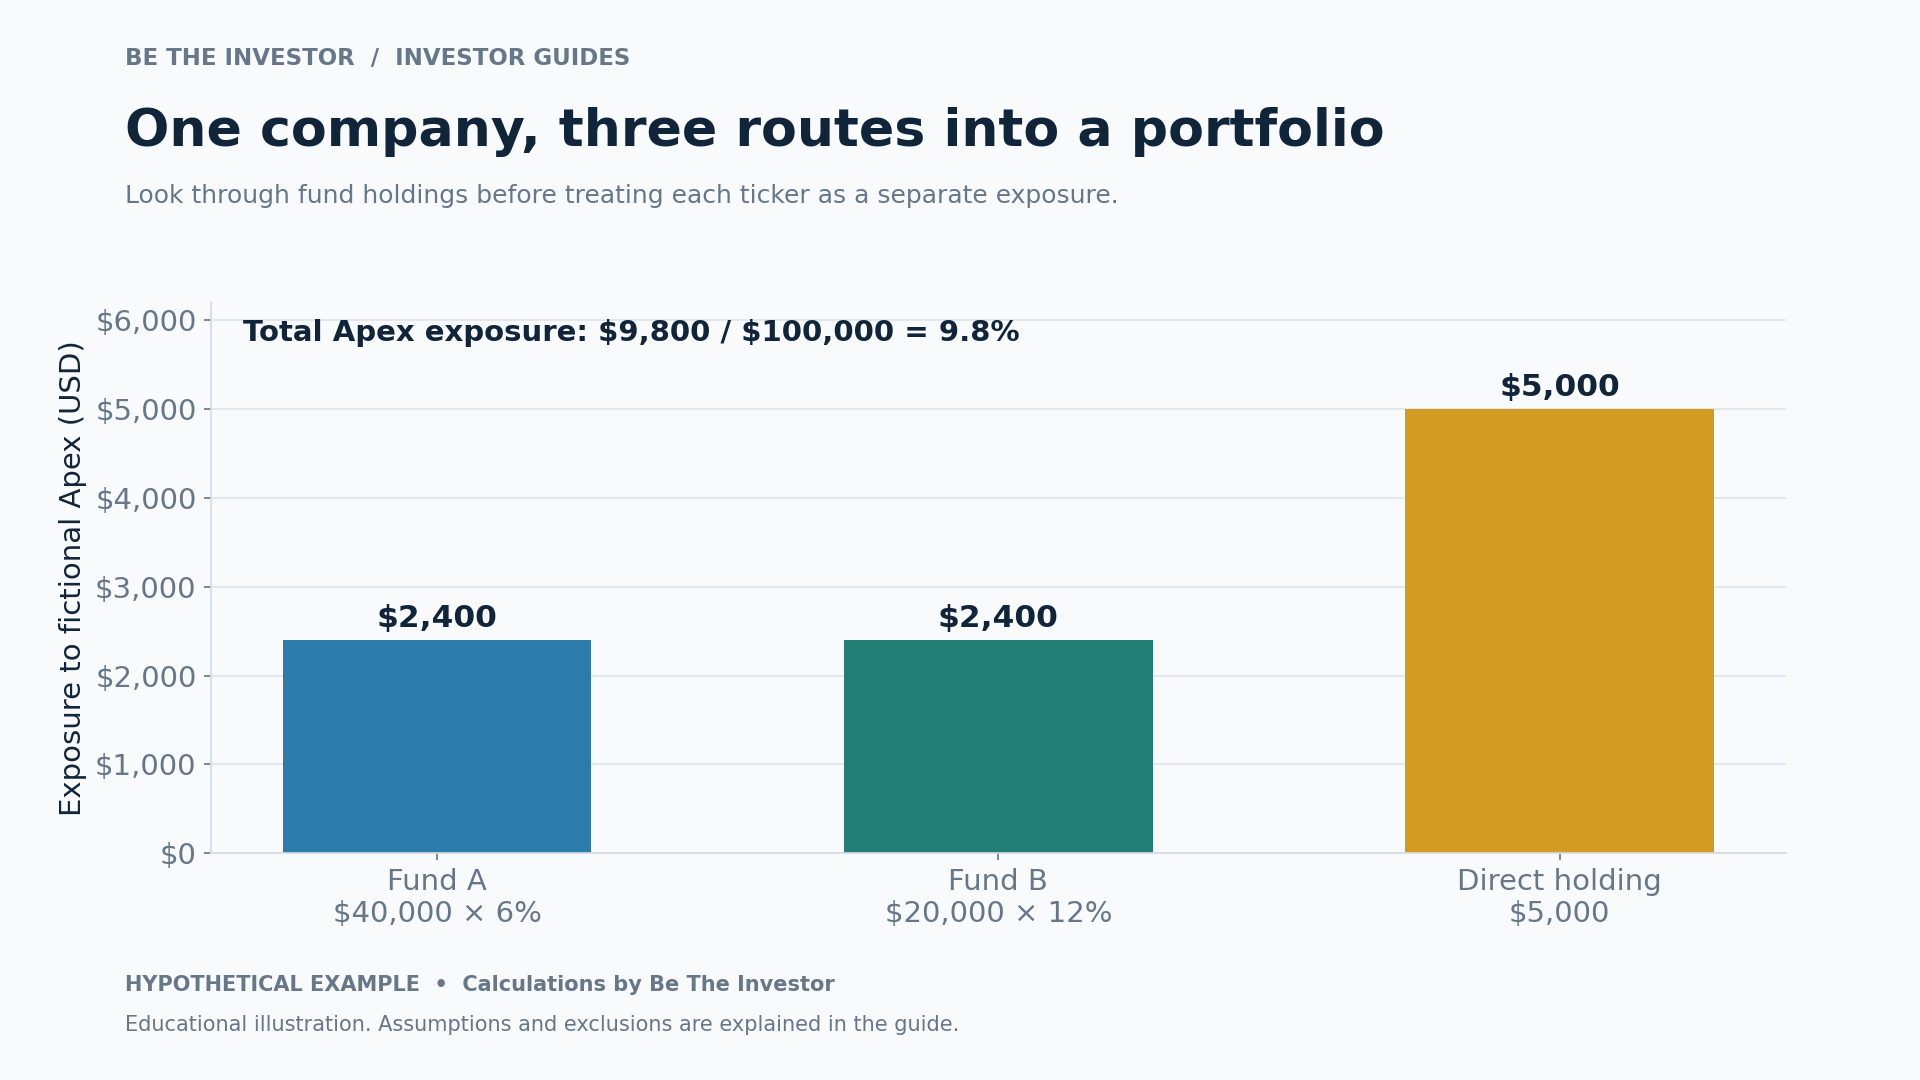
Worked example: two funds can increase the same company exposure
Hypothetical assumptions: a $100,000 portfolio holds $40,000 in Fund A, $20,000 in Fund B and $5,000 directly in Apex. Apex is 6% of Fund A and 12% of Fund B. The remaining $35,000 is assumed to have no additional Apex exposure. These are invented holdings, not current data for any real ETF.
| Holding | Calculation | Exposure to Apex |
|---|---|---|
| Fund A | $40,000 × 6% | $2,400 |
| Fund B | $20,000 × 12% | $2,400 |
| Direct Apex shares | $5,000 × 100% | $5,000 |
| Total | $9,800 ÷ $100,000 | 9.8% of the portfolio |
The general formula is direct exposure plus the sum of each fund's portfolio weight multiplied by the security's weight inside that fund. Repeat the exercise for important issuers and sectors. FINRA's concentration-risk guidance specifically highlights overlap between funds and directly owned securities.
4. Separate ongoing costs from trading costs
The expense ratio measures annual fund operating expenses relative to assets. It is reflected in the fund's value over time, rather than normally arriving as a separate annual bill. Trading can add brokerage charges, currency-conversion costs and a bid-ask spread. The SEC's ETF bulletin explains these cost layers and the distinction between market price and net asset value.
Hypothetical expense comparison: assume a constant $20,000 balance for one year, no returns or cash flows, and expense ratios of 0.08% and 0.25%. Approximate annual operating costs are $16 and $50, respectively. The difference is $34. Actual charges depend on changing asset values and the fund's accounting, so this is a comparison shortcut, not a billing forecast.
Hypothetical spread example: a fund is quoted at a $49.95 bid and a $50.05 ask, with enough quoted size for 400 shares. Buying 400 shares at the ask costs $20,020. An immediate sale at the unchanged bid returns $19,980. The $40 difference equals 0.20% of the $20,000 midpoint value. This assumes no market movement, commissions or taxes.
That example does not establish which fund is better. It shows why holding period and trading behavior belong in the comparison. Check whether the published expense ratio includes a temporary waiver, when it expires, and whether separate financing or transaction costs apply. Do not subtract the expense ratio again from an already net-of-expenses performance series.
5. Check tracking on a consistent basis
For an index ETF, compare fund and benchmark total returns over identical dates, in the same currency, with consistent treatment of distributions. Check whether the benchmark is a price index or a total-return index and whether dividend withholding is reflected. A comparison that mixes these conventions can manufacture a gap that is not an implementation failure.
Two useful calculations answer different questions:
- Tracking difference: the fund's return minus the benchmark return over a stated period. In a hypothetical year with an 8.00% benchmark return and a 7.75% fund return, the difference is minus 0.25 percentage points, or minus 25 basis points.
- Tracking error: the variability of the fund's periodic return differences relative to the benchmark. Record the observation frequency and annualization convention before comparing providers' figures.
A stable return shortfall and an erratic return gap are different problems. Investigate fees, sampling, cash balances, trading and tax effects before attributing either to poor management. Treat backtested index performance separately from a live fund record.
6. Examine liquidity and execution
Average trading volume is useful, but it does not capture an ETF's entire liquidity. The liquidity of its underlying assets and the creation/redemption process also matter. Vanguard's ETF liquidity explanation distinguishes these layers. Assess the spread, displayed size, underlying market and transaction size together.
Check a fund's premium or discount to net asset value, but compare timestamps. An overseas market may be closed while the ETF is trading, so an older NAV can differ from an updated market assessment. A displayed discount alone is not proof of a bargain.
Before an order, inspect the live quote and available liquidity. A limit order can constrain the price you accept, but it may not execute. A market order prioritizes execution without guaranteeing the price. These tradeoffs are explained in the SEC's order-types bulletin. A low annual fee does not protect against a poorly executed transaction.
7. Review currency, domicile and distributions
The currency used to quote a share is not a complete description of currency exposure. Identify the currencies of the underlying assets and whether the fund explicitly hedges them. Foreign exchange movements can change returns when translated into an investor's home currency; the SEC's international-investing guide describes that risk.
Record the fund's domicile, distribution policy, broker availability and relevant account restrictions. Tax treatment depends on the product, account and investor's jurisdiction. Avoid assuming that an accumulating share class eliminates tax obligations or that a U.S. tax-efficiency claim applies unchanged to a foreign investor. Verify these points using the current prospectus and locally applicable guidance before comparing after-tax outcomes.
8. Practice with issuer documents: Vanguard's VTI fund
Open Vanguard's official VTI product page and its linked prospectus. Use this as a document-reading exercise, not a recommendation or a source of assumptions for the invented funds above.
- Find the current investment objective and benchmark. Write their names exactly as the current documents state them.
- Locate the holdings, expense information and trading disclosures. Save each figure's date separately.
- Explain which portfolio role the mandate could serve and which exposures it does not address.
- Choose one security from the actual dated holdings file and calculate its combined exposure across a hypothetical portfolio.
The output should be an evidence sheet, not a copied marketing description. If older documents and the current issuer page differ, establish which document controls the present mandate before making a comparison.
A reusable ETF comparison sheet
| Question | Evidence to record | Decision it supports |
|---|---|---|
| What will I own? | Objective, benchmark, structure, holdings date | Whether the exposure fits the intended job |
| What overlaps? | Issuer and sector look-through weights | Whether the fund adds diversification |
| What does ownership cost? | Expense ratio, waiver terms, broker and currency charges | Ongoing cost comparison |
| How does it trade? | Spread, quote size, premium/discount and timestamps | Execution planning |
| How well does it implement? | Consistent fund/benchmark returns and gap calculations | Tracking assessment |
| What would change my view? | Mandate, cost, concentration or liquidity changes | Monitoring and replacement criteria |
Common mistakes to catch before investing
- Comparing funds with different mandates using fees alone.
- Counting tickers without measuring overlapping underlying holdings.
- Treating distributions as additional return without accounting for changes in fund value.
- Using a historical spread, holding count or expense waiver as though it were current.
- Confusing a quoted trading currency with a currency-hedged portfolio.
- Choosing the strongest recent performer without identifying the exposure that drove it.
Frequently asked questions
Is the ETF with the lowest expense ratio always preferable?
No. First match the mandate. Then compare tracking, trading costs, structure and portfolio overlap. The lowest fee for an unsuitable exposure does not solve the investment problem.
Does owning several ETFs automatically diversify a portfolio?
No. Several funds can hold the same companies or depend on the same economic drivers. Calculate look-through exposures and evaluate the portfolio as a whole.
Should I compare ETF share prices?
Not as a measure of value. Share price depends partly on how a fund divides its assets into shares. Compare exposure, total costs and portfolio fit instead; verify practical minimum-trade constraints separately.
How often should the research sheet be updated?
Refresh it before an investment decision and when the mandate, costs or portfolio role change. Keep a chosen review schedule, and always attach dates to holdings and trading data.
Continue the learning path
Apply the comparison to your full portfolio with Portfolio Diversification, Position Sizing and Risk. For research on underlying companies, use BTI's fundamental stock-research guide.
Educational material. Hypothetical examples illustrate methods and are not forecasts, model portfolios or personalized investment recommendations.
Continue your investor learning path
Use the investor guides learning path to choose your next topic and connect this research step with your investment plan.
Sources and further reading
Primary research sources checked on November 6, 2026. Open the original documents again before making a decision based on information that may change.
Cover photograph: Photo by Keenan Constance on Pexels. Used under the Pexels License.
Continue your VTI research
Frequently asked questions
What is "How to Choose and Compare ETFs: Holdings, Costs and Risk" about?
Compare ETFs using holdings, costs, tracking, liquidity and portfolio fit. Includes worked overlap and spread examples plus a practical research checklist.
Which stocks and assets does this article cover?
This article relates to VTI.
What is the market context?
An exchange-traded fund can hold many securities and still be a poor fit for a portfolio. The useful comparison starts with the exposure you need, then tests how faithfully and efficiently each fund delivers it. A low expense ratio cannot compensate for buying the wrong market, taking unwanted concentration, or misunderstanding a product's structure. This guide develops a repeatable ETF research…
When was this article published?
It was published on 06 / 11 / 2026 by Be The Investor Research.