


 Be The Investor Research
Leveraged and Inverse ETFs: Daily Reset, Compounding and Risk

Understand daily-reset ETF mechanics with precise two-day examples, portfolio exposure calculations, hedge limitations and a real issuer-prospectus reading exercise.
A daily leveraged ETF targets a multiple of its benchmark's return over a specified day. It does not promise that multiple of the benchmark's return over an investor's entire holding period. An inverse ETF has the same timing issue: “opposite” usually describes the daily objective, not a guaranteed long-term hedge.
This distinction explains why a benchmark can return to its starting point while a leveraged or inverse fund loses value. It also explains why a persistent trend can produce a result better than a simple multiple of the benchmark's cumulative return. The outcome depends on daily compounding, costs and implementation.
This guide uses invented paths and perfect daily tracking to isolate the arithmetic. The examples are not actual fund performance, price forecasts or trading recommendations. A separate issuer-document exercise uses ProShares SSO to show where an investor can verify a real fund's objective and risks.
1. Read the objective and reset period literally
The SEC's leveraged and inverse ETF bulletin explains the distinction between traditional funds and products that typically target daily leveraged or inverse results. For a hypothetical fund with perfect tracking before costs:
- A 2x daily long objective targets twice the benchmark's daily return.
- A 3x daily long objective targets three times that daily return.
- A −1x daily inverse objective targets the opposite daily return.
- A −2x daily inverse objective targets twice the opposite daily return.
The operative words are “seeks,” “daily” and “before fees and expenses.” The prospectus defines the benchmark, the measurement period and the limits of the objective. Do not assume that every geared product uses the same reset schedule. FINRA's explanation of geared products also notes that holding for less than the stated period can produce a different result from the advertised factor.
An investor buying partway through the day is not necessarily starting at the fund's daily reference value. Matching a quote-to-quote return against a close-to-close benchmark return can therefore create a misleading comparison.
2. Understand what resets
The fund adjusts its economic exposure relative to its changing net assets. It may use swaps, futures and other instruments; the precise method is product-specific. The share price does not reset to an original purchase price, and yesterday's loss is not erased.
Simplified hypothetical mechanics: a 2x fund begins with $100 of net assets and $200 of benchmark exposure. A 10% benchmark rise produces a $20 gain under perfect tracking, leaving $120 of net assets. To begin the next period at 2x exposure, the target becomes $240. Actual implementation depends on the instruments and portfolio mechanics described in the prospectus.
This keeps the next day's target tied to the new asset base. It is the reason cumulative returns must be calculated by compounding each day's fund return rather than multiplying the benchmark's full-period return once.
3. Calculate a two-day round trip
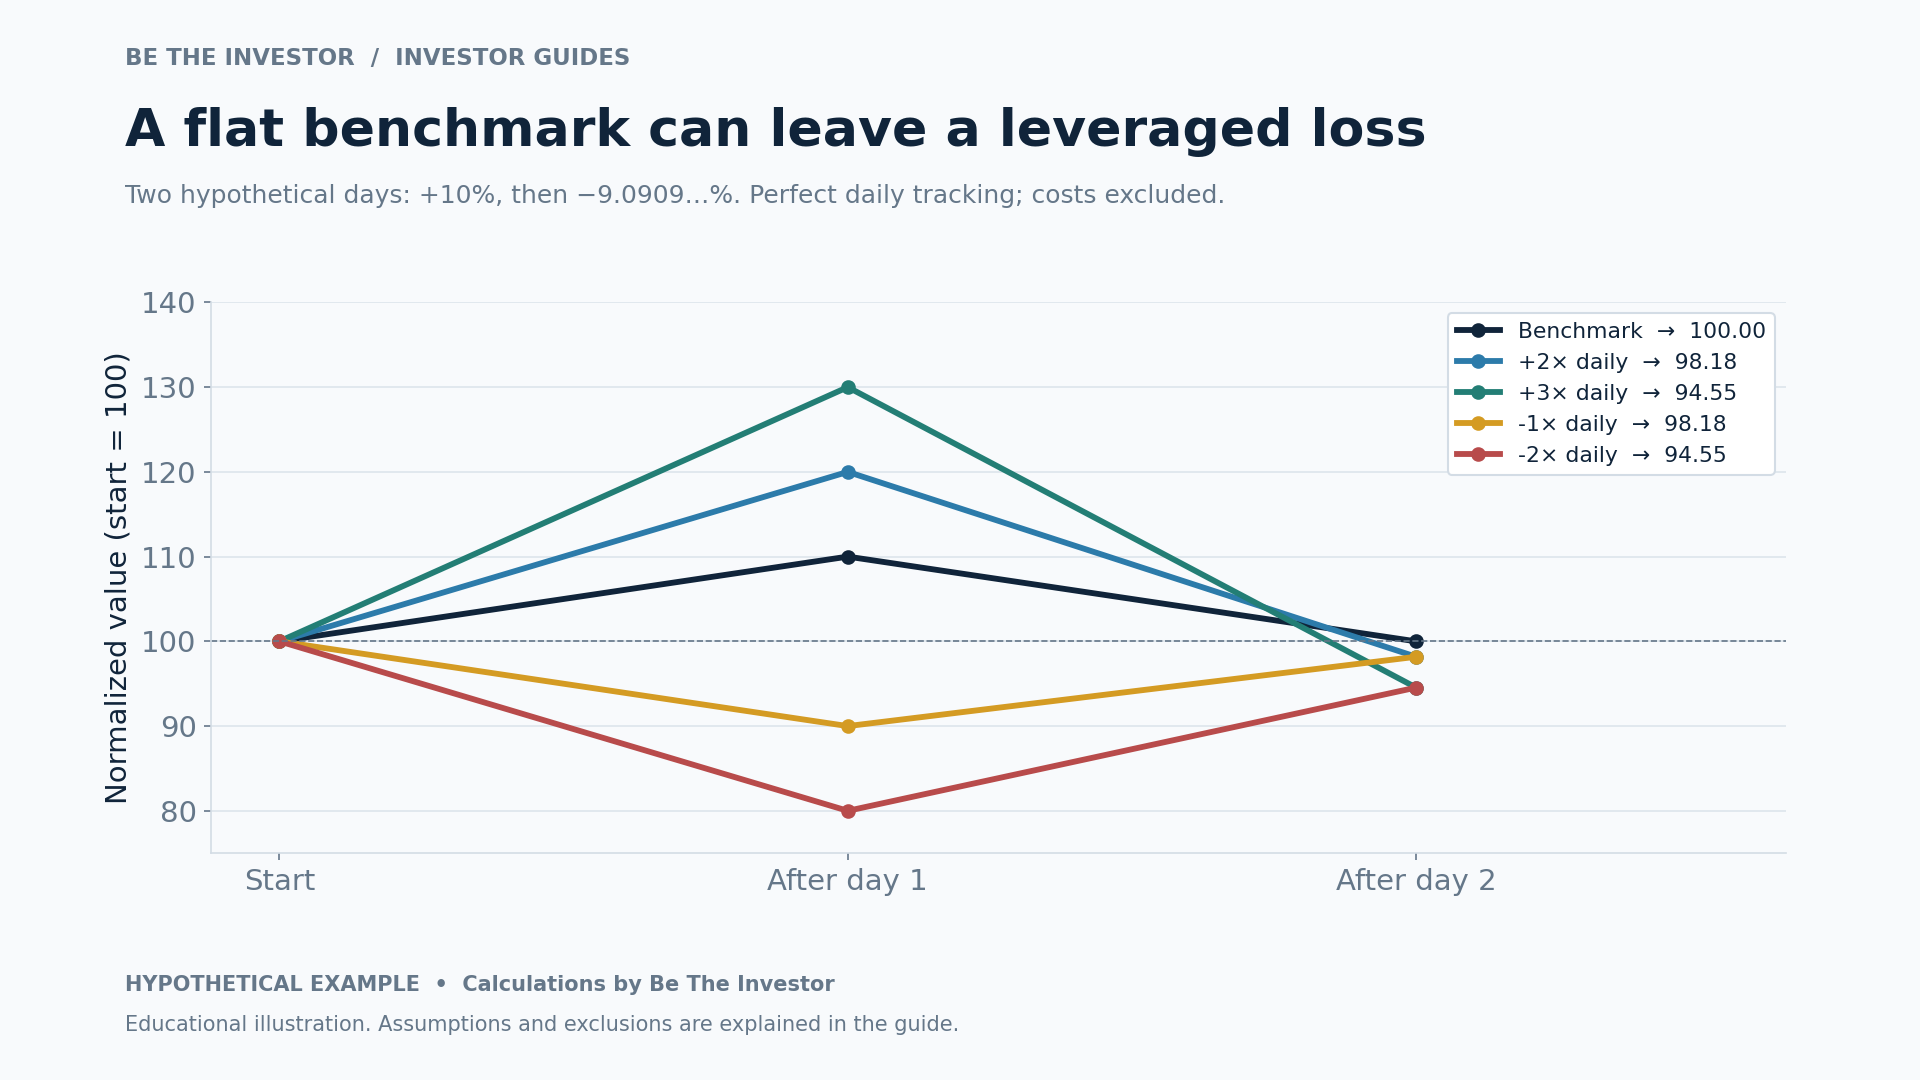
Hypothetical assumptions: all series start at 100. The benchmark rises 10% on day one and then falls by exactly 1/11, or approximately 9.0909%, on day two. That second move takes the benchmark from 110 back to 100. All funds achieve their daily objectives perfectly. Fees, financing, taxes, spreads, distributions and tracking deviations are excluded.
| Series | Start | After day one | After day two | Two-day return |
|---|---|---|---|---|
| Benchmark | 100.00 | 110.00 | 100.00 | 0.00% |
| 2x daily long | 100.00 | 120.00 | 98.18 | −1.82% |
| 3x daily long | 100.00 | 130.00 | 94.55 | −5.45% |
| −1x daily inverse | 100.00 | 90.00 | 98.18 | −1.82% |
| −2x daily inverse | 100.00 | 80.00 | 94.55 | −5.45% |
Values are rounded for display. For the 2x fund, the second-day return is −2/11, approximately −18.1818%. Its ending value is 120 × (1 − 2/11) = 98.1818. For the −1x fund, the second-day gain is 1/11, so its ending value is 90 × (1 + 1/11) = 98.1818.
Both lose despite the benchmark finishing flat. There is no daily tracking failure in the example: each fund meets its daily objective exactly. The mismatch comes from comparing a daily-reset strategy with a simple multiple of a cumulative benchmark return.
4. Use the right return formula
For daily benchmark returns r1, r2 and so on, the benchmark's cumulative return is:
(1 + r1) × (1 + r2) × … × (1 + rn) − 1.
For a hypothetical fixed daily leverage factor L with perfect tracking and no costs, the fund's cumulative return is:
(1 + L × r1) × (1 + L × r2) × … × (1 + L × rn) − 1.
These formulas generally do not equal L multiplied by the benchmark's cumulative return. They are teaching formulas for feasible return paths; they do not model fund liquidation, trading halts or extreme moves that could exhaust a fund's assets.
To audit a spreadsheet, calculate each day's benchmark return, multiply by the stated factor, apply the result to the prior day's fund value, and retain full precision until display. Keep a separate column for actual fund returns if researching a real product. That distinguishes compounding from genuine tracking differences.
5. Compounding can help a trend as well as hurt a round trip
A second hypothetical example: the benchmark gains 5% on each of two days. Its cumulative gain is 1.05 × 1.05 − 1 = 10.25%. A perfectly tracking 2x fund gains 10% each day, producing 1.10 × 1.10 − 1 = 21.00%. Twice the benchmark's cumulative gain would be only 20.50%.
Therefore, “leveraged ETFs always decay” is an incomplete description. The daily-return path matters. A flat benchmark with no movement and a flat benchmark after large offsetting moves have the same endpoint but different implications for a daily-reset fund. Costs add another drag, while favorable compounding can sometimes outweigh part of that drag.
This does not provide a reliable way to forecast returns from a broad directional view. Knowing that a benchmark might end higher does not specify its daily moves, financing costs or tracking. A long-term thesis about an index is not by itself a complete thesis for holding a leveraged fund tied to it.
6. Translate fund leverage into portfolio exposure
Look at both cash invested and starting economic exposure. In a hypothetical unleveraged portfolio, allocating 5% of capital to a 3x daily fund creates approximately 15% of portfolio value in initial benchmark exposure through that position, before implementation differences. It does not make the entire portfolio 3x leveraged.
If the benchmark falls 10% during the relevant daily period and the fund falls exactly 30%, that 5% position subtracts 1.5 percentage points from the portfolio, assuming every other holding is unchanged. Larger moves or repeated adverse days can produce a different cumulative result.
Also distinguish product-level leverage from borrowing in the investor's account. The SEC's leveraged-investing guidance explains that losses on a fully paid long ETF investment are generally limited to the money invested, while buying on margin can expose the investor to losses beyond that amount.
Recovery becomes demanding after a large drawdown. In a hypothetical case, a 60% loss leaves 40 out of an initial 100. Returning to 100 requires a 150% gain. A later rebound in the benchmark does not automatically restore the fund to its earlier value.
7. Understand costs and hedge limitations
Inspect the expense table, then read the paragraphs around it. Operating expenses are not necessarily the entire economic cost of leverage. The SSO summary prospectus, for example, separately identifies transaction and financing costs associated with securities and derivatives that are not included in its displayed expense example. This guide does not quote a current fee or estimate future financing costs.
Derivatives, counterparty exposure, trading conditions and the relationship between market price and net asset value can also affect the result. A comparison based solely on the headline expense ratio leaves out important implementation questions.
An inverse product is not a guaranteed hedge for an unrelated stock portfolio. The portfolio may fall while the chosen benchmark rises, or the two may move by different amounts. Daily resets also change the exposure relationship over time. This mismatch, commonly called basis risk, should be evaluated alongside cost, monitoring requirements and the simpler alternative of reducing the original position.
For a framework that separates scenario budgets from guaranteed loss limits, read Portfolio Diversification, Position Sizing and Risk.
8. Do not confuse volatility products with an inverse equity index
A volatility-linked product can reference futures or other derivatives tied to volatility rather than the spot level displayed on a market screen. FINRA's volatility-investing guidance explains that VIX futures do not track the VIX precisely and that volatility products can lose value rapidly.
Read the exact benchmark and contract exposure. A product following a rolling futures index has a different investment proposition from an inverse equity-index fund. If leverage is added, the daily factor applies to the specified futures benchmark, not automatically to the spot volatility index. “The market may fall” is not enough information to predict the return of either instrument.
Practice with issuer documents: ProShares SSO
Open the official SSO page and its summary prospectus. The prospectus reviewed for this guide is dated September 28, 2026. Its stated objective is twice the S&P 500's daily performance before fees and expenses.
- Locate the investment objective and identify how the document measures a day.
- Read the holding-period and leverage risks before studying performance.
- Distinguish operating expenses from separately discussed transaction and financing costs.
- Explain why the hypothetical two-day table above is not an estimate of SSO's actual return.
This is a disclosure-reading exercise. Check the latest prospectus and any supplements before using a real product; the example does not recommend buying SSO or any inverse alternative.
A decision checklist for daily-reset products
- Can I name the exact benchmark, leverage factor and reset period?
- Can I reproduce the two-day calculation without multiplying the full-period benchmark return once?
- Have I separated a directional market view from a view about the path and holding period?
- Do I understand costs, structure, liquidity and the possibility of imperfect daily tracking?
- Have I measured portfolio exposure rather than only cash invested?
- If the position is a hedge, what mismatch could cause it to fail?
- What event, exposure limit or review date determines when the position is reassessed?
Frequently asked questions
Must a daily-reset ETF be sold after one day?
The objective describes its measurement period, not a universal holding prohibition. Holding longer requires understanding cumulative behavior and monitoring. Suitability depends on the product and investor's purpose.
Can a leveraged ETF lose while its benchmark is flat?
Yes. The first worked example shows a loss even with perfect tracking and no costs. Offset moves compound on different asset bases.
Can it outperform the simple multiple over several days?
Yes. The two-day upward example produces 21.00% for the hypothetical 2x fund against 20.50% for twice the benchmark's cumulative return. Favorable arithmetic is not a return promise.
Does a stop order create a guaranteed maximum loss?
No. Gaps and execution conditions can produce a worse price; a stop-limit may not execute. The SEC's stop-order bulletin explains those limitations.
What is the first alternative to compare?
Compare the intended result with holding the underlying unleveraged exposure at a suitable size, reducing an existing position, or retaining cash. The comparison should address the actual objective, including costs and risks.
Educational material. All numerical paths are hypothetical and exclude costs unless stated. They are not actual fund performance, forecasts or personalized investment advice.
Continue your investor learning path
Use the investor guides learning path to choose your next topic and connect this research step with your investment plan.
Sources and further reading
Primary research sources checked on November 6, 2026. Open the original documents again before making a decision based on information that may change.
- SEC: Updated Investor Bulletin: Leveraged and Inverse ETFs
- FINRA: The Lowdown on Leveraged and Inverse Exchange-Traded Products
- SEC: Leveraged Investing Strategies
- ProShares: SSO Official Product Page
- ProShares SSO Summary Prospectus, September 28, 2026
- FINRA: Volatility Investing
- SEC: Stop, Stop-Limit, and Trailing Stop Orders
Cover photograph: Photo by Travel with Lenses on Pexels. Used under the Pexels License.
Continue your SSO research
Frequently asked questions
What is "Leveraged and Inverse ETFs: Daily Reset, Compounding and Risk" about?
Learn how leveraged and inverse ETFs compound daily. Worked examples explain flat-market losses, trending returns, portfolio exposure and key prospectus risks.
Which stocks and assets does this article cover?
This article relates to SSO.
What is the market context?
A daily leveraged ETF targets a multiple of its benchmark's return over a specified day. It does not promise that multiple of the benchmark's return over an investor's entire holding period. An inverse ETF has the same timing issue: “opposite” usually describes the daily objective, not a guaranteed long-term hedge. This distinction explains why a benchmark can return to its starting point while a…
When was this article published?
It was published on 06 / 11 / 2026 by Be The Investor Research.