


 Be The Investor Research
How to Read Earnings Reports and Guidance

A practical earnings-report workflow covering comparable estimates, profit quality, cash flow, guidance changes, and the next operating test.
To read an earnings report, compare what the business delivered with a clearly defined expectation, examine the quality of those results, and determine what the new outlook changes. Revenue and earnings per share are starting points. A useful conclusion also explains margins, cash generation, the drivers of demand, and the assumptions needed for the next reporting period.
This guide focuses on public-company earnings analysis using U.S. reporting conventions. Every worked numerical example is hypothetical and describes a fictional company. The NVIDIA source-navigation exercise near the end is separate from those examples.
- 1. Assemble the original source documents
- 2. Establish a comparable expectation
- 3. Read a results table without stopping at the headline
- 4. Explain where earnings growth came from
- 5. Separate a full-year guidance increase from a better forward outlook
- 6. Identify the operating evidence behind the forecast
- 7. Finish with a usable review note
- Practice with a live filing
- Frequently asked questions
1. Assemble the original source documents
Start with the company's earnings release and its accompanying tables. Then open the relevant regulatory filing, presentation, management commentary, and earnings-call recording or transcript. Keep the previous release and previous guidance beside them. You need both versions to identify a change.
For most U.S. domestic issuers, the annual Form 10-K contains audited annual financial statements; Form 10-Q contains unaudited statements for the first three fiscal quarters. An earnings release may appear before the detailed filing. Foreign issuers can use different forms. Investor.gov explains the differences between these reports.
A current report on Form 8-K can include the earnings release as an exhibit. The SEC's guide to Form 8-K describes this reporting sequence. Treat an early analysis as provisional when a missing footnote could change the conclusion.
Record the fiscal period, publication date, currency, units, and whether each metric is reported or adjusted. A figure shown in thousands is easy to misread as millions. A company's fiscal year also may not match the calendar year.
2. Establish a comparable expectation
Use three distinct comparison columns: the same period a year earlier, the company's previous guidance, and a documented analyst estimate. These answer different questions. Year-over-year growth describes the business trajectory; guidance comparison tests delivery against management's own outlook; consensus comparison measures the result against a particular estimate set.
- Match the accounting basis. Compare GAAP diluted earnings per share with a GAAP estimate, and adjusted earnings with a comparably defined adjusted estimate.
- Match the period. A next-quarter estimate cannot be compared with a full-year outlook. Check the fiscal-quarter end date.
- Match the business perimeter. Acquisitions, disposals, currency movements, and reporting changes can affect comparisons. Keep reported and organic growth separately labeled.
- Preserve the estimate timestamp. An estimate refreshed after the announcement is not the expectation that existed before it.
Analyst consensus is a collection of forecasts, not management guidance or an objective fact about future results. FINRA's due-diligence guidance makes this distinction. If a reliable pre-release estimate is unavailable, say so and use the comparisons you can verify.
3. Read a results table without stopping at the headline
Hypothetical example: a fictional industrial company reports the following quarterly results. Dollar amounts are in millions, except per-share figures. The consensus inputs are invented solely for this exercise and were assumed to exist before the release.
| Metric | Prior-year quarter | Current quarter | Comparable consensus |
|---|---|---|---|
| Revenue | $1,000 | $1,200 | $1,150 |
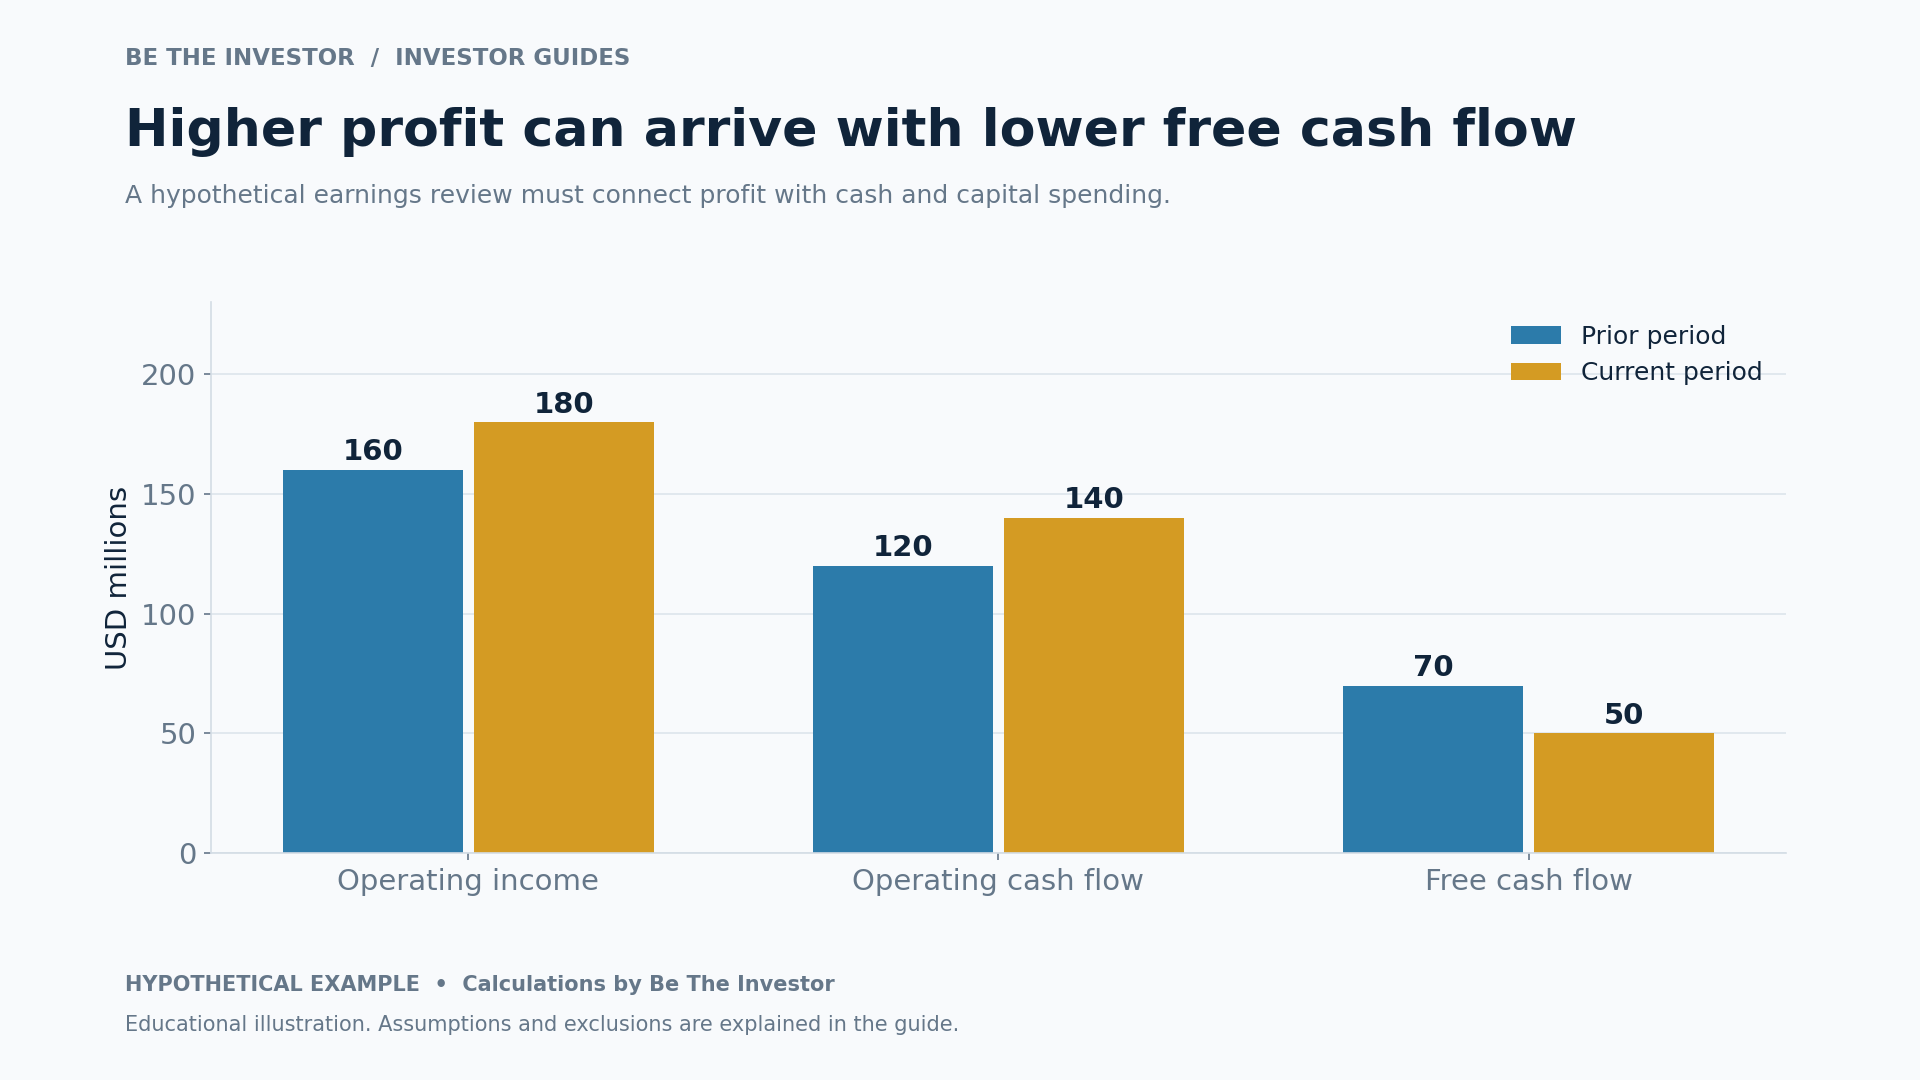
| Operating income | $160 | $180 | Not assumed |
| GAAP diluted EPS | $1.00 | $1.10 | $1.02 |
| Adjusted diluted EPS | $1.18 | $1.32 | $1.28 |
| Operating cash flow | $120 | $140 | Not assumed |
| Capital expenditure | $50 | $90 | Not assumed |
Revenue growth is ($1,200 / $1,000) − 1 = 20.0%. The revenue surprise is ($1,200 / $1,150) − 1 = 4.35%. Adjusted EPS exceeds its matched estimate by ($1.32 / $1.28) − 1 = 3.13%. These are three different calculations.
Operating income grows 12.5%, but operating margin falls from $160 / $1,000 = 16.0% to $180 / $1,200 = 15.0%. That is a decline of 1 percentage point, or 100 basis points. The company sold more while retaining less operating profit from each revenue dollar.
Our analytical free-cash-flow definition for this example is operating cash flow minus capital expenditure. It falls from $70 million to $50 million, a 28.6% decline. Higher revenue, higher EPS, and weaker cash remaining after capital expenditure can therefore occur together. The next question is whether the investment supports future demand or merely sustains existing operations.
This calculation does not prove a weak quarter. It identifies the debate: growing sales, compressing margins, and heavier investment. The SEC notes that free cash flow has no uniform definition, so check each company's calculation before comparing it with this example or a peer.
4. Explain where earnings growth came from
Build an earnings bridge from operations to the amount available to common shareholders. Look for changes in sales mix, production costs, operating expenses, interest, taxes, unusual gains, and the diluted share count. A favorable tax item has a different implication from recurring product demand.
Separate hypothetical example: net income available to common shareholders remains $100 million, while weighted-average diluted shares decline from 100 million to 95 million. EPS rises from $1.00 to approximately $1.053, or 5.3%, without net-income growth. The calculation explains the mechanism; it does not establish whether the repurchases created value.
Read the reconciliation between GAAP and adjusted earnings. For each exclusion, ask whether it is cash or noncash, whether it recurs, and whether it represents an economic cost of running the business. Stock-based compensation may be noncash in the period while still affecting shareholder dilution. Repeated restructuring charges deserve a history, rather than automatic acceptance as exceptional.
The SEC's non-GAAP guidance emphasizes clear labels and reconciliations and explains that adjustments can still mislead. Present both accounting bases and state your interpretation instead of relabeling adjusted profit as the uniquely correct earnings figure.
Cash flow provides another check. Review receivables, inventory, payables, and customer prepayments. A cash improvement caused by collecting old receivables has a different repeatability profile from stronger ongoing sales. The SEC's financial-statement guide explains how operating cash flow reconciles profit with noncash items and changes in operating assets and liabilities.
5. Separate a full-year guidance increase from a better forward outlook
Guidance is management's forecast or target, with a stated period and assumptions. Preserve the lower bound, upper bound, accounting basis, and any conditions. A midpoint is a calculation for comparison; it is not a probability-weighted expected outcome.
Hypothetical guidance example: the previous full-year revenue range is $4.60 billion to $4.80 billion, with a $4.70 billion midpoint. Before the release, your own model allocates $1.10 billion to the first quarter and $3.60 billion to the remaining quarters. The company reports $1.20 billion and raises its full-year range to $4.70 billion to $4.90 billion.
The new midpoint is $4.80 billion. Subtract the delivered $1.20 billion and the implied remaining-year revenue is $3.60 billion. The $100 million headline increase is fully absorbed by the better completed quarter; it adds nothing to the remaining-year revenue in your original model. The $1.10 billion allocation was your assumption, not a management statement.
Now assume next-quarter revenue guidance is $1.18 billion to $1.24 billion. Its $1.21 billion midpoint is 3.2% below a hypothetical comparable consensus of $1.25 billion. A company can raise the full-year total while providing a near-term outlook below analyst expectations.
Also inspect what is absent. If management guides revenue but not margins, do not treat your margin forecast as company guidance. If a target is conditional on a product launch, retain that condition in the model.
6. Identify the operating evidence behind the forecast
Choose metrics that connect to the business model. For a manufacturer, examine units, pricing, utilization, inventory, and customer concentration. For a subscription business, examine customer growth, retention, contract duration, and the conversion of contracted business into revenue. A large pipeline is not automatically a binding order.
Definitions matter. A customer count may include unpaid accounts; a retention metric may cover only a selected customer cohort. The SEC's guidance on operating metrics calls for context about calculation methods and material changes. Keep the definition beside your historical series.
Use the earnings call to resolve the largest gaps. Write questions that can change a forecast: Is the margin decline temporary? Which investment costs recur? Has delivery timing moved? Are customer commitments cancellable? For each answer, distinguish a quantified commitment, management's qualitative assessment, and your own inference.
Do not infer the cause of a share-price move solely from the earnings release. Guidance, starting valuation, market conditions, and investors' expectations can all matter. A defensible earnings analysis explains the operating result first and treats the market reaction as a separate question requiring contemporaneous evidence.
7. Finish with a usable review note
Complete this checklist before updating an investment view:
- Delivery: Which comparable revenue, margin, EPS, and cash-flow figures changed?
- Quality: How much came from recurring operations, adjustments, taxes, or share count?
- Outlook: What changed for future periods after separating already-delivered results?
- Model: Which revenue drivers, costs, investment needs, or dilution assumptions require revision?
- Evidence gap: What remains unconfirmed, and which filing or management disclosure can resolve it?
- Next test: Which operating metric at the next relevant report would support or contradict your interpretation?
Label each important sentence as a reported fact, management forecast, analyst estimate, or your assessment. This keeps a positive company narrative from silently becoming a verified financial conclusion.
Practice with a live filing
NVIDIA, listed on Nasdaq under NVDA, provides an official financial-reports page and an SEC-filings archive. Select one fiscal quarter, locate its release and corresponding filing, and identify the revenue table, earnings reconciliation, guidance section, and cash-flow statement. Record the actual document dates yourself. This is an exercise in finding evidence, not a recommendation or a current assessment of NVIDIA. None of the fictional calculations above represents NVIDIA's results.
Frequently asked questions
Is an earnings release the same as a Form 10-Q?
No. A release highlights selected results and commentary. The quarterly filing contains the formal financial statements, notes, and other disclosures. Read both when available; use the annual filing for the full-year reporting context.
Why can a stock decline after an earnings beat?
A beat describes a comparison with a particular estimate. It does not establish that the forward outlook improved or that the starting price offered attractive value. Verify the estimate basis and look at guidance and market evidence before attributing a decline to one cause.
Should I use GAAP or adjusted EPS?
Review both and reconcile them. Use a matching basis for comparisons, then decide which adjustments clarify operating performance and which remove recurring costs. Keep that judgment explicit.
How should I calculate a surprise when expected earnings are negative?
State the actual and expected loss per share and the dollar difference first. A conventional percentage can reverse intuition when its denominator is negative or become unstable near zero. If a provider reports a percentage, check and disclose its formula.
What should I read next?
Use the financial-statements guide to investigate accounting details, the stock-valuation guide to connect forecasts to value, and the analyst-ratings guide to interpret external forecasts.
Educational research methodology. Hypothetical calculations are illustrations, not forecasts or investment recommendations.
Continue your investor learning path
Use the investor guides learning path to choose your next topic and connect this research step with your investment plan.
Sources and further reading
Primary research sources checked on November 6, 2026. Open the original documents again before making a decision based on information that may change.
Cover photograph: Photo by Werner Pfennig on Pexels. Used under the Pexels License.
Continue your NVDA research
Frequently asked questions
What is "How to Read Earnings Reports and Guidance" about?
Learn how to read earnings reports, compare results with expectations, assess profit quality, and interpret guidance using worked examples and a checklist.
Which stocks and assets does this article cover?
This article relates to NVDA.
What is the market context?
To read an earnings report, compare what the business delivered with a clearly defined expectation, examine the quality of those results, and determine what the new outlook changes. Revenue and earnings per share are starting points. A useful conclusion also explains margins, cash generation, the drivers of demand, and the assumptions needed for the next reporting period. This guide focuses on…
When was this article published?
It was published on 06 / 11 / 2026 by Be The Investor Research.