




Healthcare ETF Flows Are Recovering After a Strong Biopharma Rally

J.P. Morgan sees healthcare ETF flows recovering after years of relative weakness, while large-cap biopharma has already outperformed. The setup could support further rotation, but fund flows alone are not enough to sustain the sector’s valuation gains.
Healthcare stocks have already outperformed in 2026, and J.P. Morgan sees fund flows beginning to catch up. The bank’s U.S. large-cap biopharma work, as reported by Benzinga, suggests that a multi-year period of weak relative ETF flows may be reversing, creating a potential second tailwind for a sector that has already benefited from stronger stock performance.
According to the source, J.P. Morgan’s positioning data through September 2 showed $8.3 billion of year-to-date inflows into healthcare ETFs, equal to 5.9% of assets. Technology ETFs had attracted much more capital in absolute terms, but healthcare flows were improving after diverging from broader ETF inflows beginning in 2023.
Performance has already moved ahead of the fund-flow recovery. J.P. Morgan said U.S. large-cap biopharma had gained 22% year to date, compared with a 14% increase for the S&P 500. The bank also said the group outperformed in 2025. That means the rotation thesis is no longer based on a depressed sector waiting for a catalyst. Investors are considering whether capital flows can reinforce a move that is already underway.
Valuation remains part of the case. The source says large-cap biopharma traded at about a 5% discount to the S&P 500 on next-12-month earnings, with the discount widening to roughly 15% when Eli Lilly is excluded. Those figures are J.P. Morgan estimates and should not be treated as universal market multiples because methodology, index composition and forward earnings assumptions can differ across data providers.
For broad exposure, the Health Care Select Sector SPDR Fund is one of the most relevant vehicles. The source identified Eli Lilly, Johnson & Johnson, AbbVie, Merck and Gilead among major holdings. A healthcare ETF therefore allows investors to express a sector-rotation view without depending on a single drug, regulatory decision or clinical catalyst.
The Vanguard Health Care ETF offers a broader sector basket, while the SPDR S&P Biotech ETF provides more concentrated exposure to biotechnology and generally carries higher company-specific and clinical risk. These vehicles are not interchangeable. Large pharmaceutical companies tend to have established cash flows, dividends and diversified portfolios, while biotech funds can be much more sensitive to trial results, financing conditions and regulatory outcomes.
The core investment question is whether healthcare can continue to attract capital after its recent outperformance. A sustained flow recovery could support valuations, but fund flows are not a fundamental earnings driver by themselves. They can amplify demand for the sector while underlying returns still depend on product launches, patent cycles, pipeline execution, pricing policy and earnings growth.
Policy risk also remains relevant. Healthcare can look defensive relative to economically sensitive sectors, yet pharmaceutical pricing, reimbursement rules and regulatory decisions can quickly change company-level expectations. The sector’s lower sensitivity to AI disruption does not make it low risk.
The better way to use the flow data is as a positioning signal. If fundamentals remain stable and healthcare continues receiving a larger share of incremental ETF capital, the sector can benefit from both earnings support and multiple normalization. If performance stalls while flows reverse again, the same mechanism can work in the opposite direction.
BTI’s bottom line: the healthcare rotation has moved beyond a purely contrarian setup. J.P. Morgan’s reported flow data suggest investors are returning to the sector after years of relative neglect, but the next leg depends on fundamentals holding up after a strong run rather than on ETF inflows alone. Concentration inside the major healthcare ETFs is another consideration. A fund labeled as broad healthcare exposure can still be heavily influenced by a handful of mega-cap pharmaceutical companies. Strong performance from Eli Lilly, AbbVie or Johnson & Johnson can materially affect sector returns even when smaller healthcare companies lag.
This also means investors should separate the sector-rotation thesis from a pure defensive thesis. Healthcare can benefit when investors move away from richly valued technology, but parts of the sector remain growth-sensitive and catalyst-driven. Biotechnology, managed care, medical devices and large-cap pharmaceuticals can behave very differently in the same market environment. ETF selection therefore changes the type of healthcare exposure an investor actually owns.
Continue your LLY research
Related News
Moderna's Melanoma Data Must Justify a Rally Analysts Do Not
Moderna rallied ahead of full Phase 3 melanoma data due Oct. 24, even as Goldman Sachs kept a Neutral rating and set a target well below the share price.
Biotech Catalysts Put Moderna and Achieve Life Sciences in Focus
A dense clinical calendar gives investors several binary events, led by Moderna and Merck’s melanoma program and Achieve Life Sciences’ response to an FDA manufacturing rejection.

ARK's Third Quarter Was Powered by AI Biology, Not Its Famous Names
10x Genomics and other AI-linked biotech holdings drove ARK's third-quarter gains, while Tesla and Rocket Lab detracted. Contribution data show where fund performance actually came from.

One BlackRock Fund Drove 93% of Ether ETF Outflows
U.S. spot Ether ETFs lost about $320 million in the week through Oct. 16, but $299 million came from BlackRock's ETHA, making the selloff unusually concentrated.
VOO Beat VXUS Over 10 Years, but That Does Not Set the Next Decade
VOO’s trailing 10-year total return far exceeded VXUS through October 2026, yet the comparison reflects U.S. concentration, currency and valuation as much as fund quality.

What It Really Takes to Generate $4,950 a Month From JEPQ, Realty Income and Main Street
A three-security income portfolio can be modeled to pay $59,400 a year, but the required capital and reliability depend on variable option income, real-estate cash flow and supplemental dividends that are not guaranteed.
Where JEPQ and Main Street Fit in a Taxable Account or IRA

High cash distributions can create a tax bill that looks very different from the headline yield. That makes account placement important for JPMorgan's JEPQ and Main Street Capital, but there is no universal rule that one belongs in a taxable account and the other in an IRA.
JEPQ generates income from stock dividends and an options strategy. The fund's cash distributions can contain ordinary income, qualified dividends, capital gains or return of capital depending on the portfolio's realized activity and tax accounting. The mix is reported after year-end, so an investor cannot safely infer the final tax character from the monthly payment alone. In a taxable account, ordinary income is generally less tax-efficient than qualified dividends or long-term capital gains. In a traditional IRA, current tax is deferred until withdrawal, while qualified Roth IRA withdrawals can be tax-free if the statutory requirements are met.
Main Street is a regulated investment company and business development company. Its distributions likewise do not have a fixed tax character. The company says shareholders receive an annual Form 1099-DIV that identifies ordinary dividends, qualified dividends, capital-gain distributions and any return of capital. Main Street's 2026 estimate anticipated a mix rather than a single category. Supplemental dividends can also vary with portfolio income and realized gains, so neither their amount nor their tax treatment should be assumed in advance.
The practical choice begins with the investor, not the ticker. A person who needs current income before retirement may value the flexibility of a taxable account despite the annual tax cost. Someone in a high tax bracket who can leave the money invested may prefer the shelter of an IRA, especially for distributions ultimately taxed as ordinary income. But using retirement-account space also has an opportunity cost because contribution limits are finite, traditional IRA withdrawals are generally taxable, and early withdrawals can trigger taxes or penalties.
The most defensible process is to review the latest fund tax documents and the investor's own 1099-DIV, then compare after-tax income under realistic assumptions. Distribution rates, tax classifications and personal circumstances can all change. This is a framework for analysis, not individualized tax advice.
Binance's SOXL Perpetual Fell 5.9% Without Breaking Its 3% Price Band
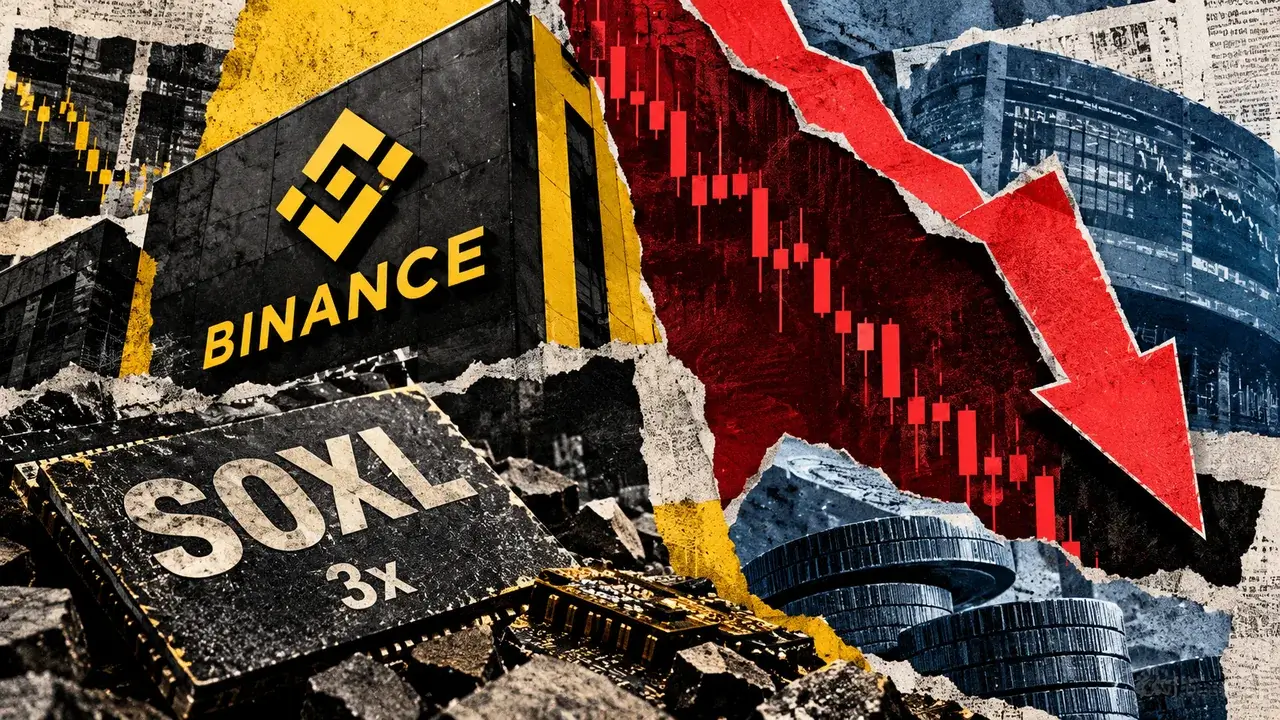
Binance's SOXL-linked perpetual contract fell 5.9% from its opening mark to its intrahour low during an October 17 weekend trading hour. At the same time, all 60 sampled minute-close differences between the mark and its reference index remained below the platform's stated 3% weekend band.
The figures are not contradictory. The 3% rule limits how far the mark can sit from the index at a given time. It does not stop the index itself from moving. During the sampled hour, the reference index declined nearly 4%, carrying the band and the mark lower together.
That distinction matters because Binance's contract trades while the underlying SOXL shares on NYSE Arca are closed. The weekend reference can be derived from crypto order-book inputs and smoothing procedures rather than a new exchange print for the ETF. Traders therefore hold exposure to Binance's reference methodology as well as semiconductor-market expectations.
Liquidation adds another layer. A position is closed when the mark reaches an account-specific threshold determined by collateral, leverage and margin mode. Staying within the mark-to-index band does not protect a highly leveraged position from liquidation after a cumulative price move.
Binance states that the contract tracks the Direxion Daily Semiconductor Bull 3X ETF and permits leverage up to 20 times. SOXL itself targets three times the daily move of a semiconductor index. Combining an equity-based leveraged product with a leveraged perpetual can create risk far beyond what a 3% reference band appears to imply.
GLDM Drew More New Money Than GLD as Fees Took Center Stage

Investors directed almost $500 million into SPDR Gold MiniShares Trust while the much larger SPDR Gold Shares received about $182 million over the reported period through October 14. Both funds hold physical bullion, so the flow gap points less to a new view on gold than to a preference for a cheaper wrapper.
State Street lists a 0.10% annual expense ratio for GLDM and 0.40% for GLD. On a $100,000 position, that difference is $300 a year before compounding. Gold produces no dividend or operating cash flow, and each trust sells a small amount of bullion to pay expenses, so a lower fee leaves investors with more gold exposure over time.
GLD still offers advantages for institutions and active traders. Its larger asset base, heavier trading volume and established options market can reduce execution costs for large or short-term trades. GLDM's lower share price and smaller fee are more relevant to long-term savers, especially when purchases are modest and options liquidity is not needed.
Taxes can overwhelm the annual savings for existing holders. Selling appreciated GLD in a taxable account realizes a gain, while both physical-gold trusts can face the higher U.S. collectibles tax rate on long-term gains. A switch therefore makes the cleanest economic case inside a tax-advantaged account or for new contributions.
The flow data does not prove GLDM will outperform gold or that GLD is obsolete. It shows that when two funds deliver nearly the same underlying exposure, investors are increasingly treating cost and trading purpose as separate decisions.
Bank OZK's Rising Dividend Is Well Covered, but Credit Still Sets the Limit

Bank OZK raised its quarterly common dividend to $0.49 on Oct. 1, the 65th consecutive quarterly increase. The new annualized rate is $1.96 per share, and the source calculated a forward yield of about 4.3% at the price then quoted.
The dividend is well covered by recent earnings. Trailing 12-month earnings of $6.06 imply a payout ratio of about 32%. Put differently, the bank retains roughly two-thirds of reported profit for capital, growth and credit losses.
Second-quarter earnings were $1.49 per diluted share, down from $1.58 a year earlier but up from $1.44 in the first quarter. Net income available to common shareholders was $163.3 million. Those figures support the current payment, even without assuming faster profit growth.
Bank OZK is also returning capital through repurchases. It authorized a new $200 million program in June after using most of a previous authorization over the preceding four quarters. Buybacks below tangible book value can increase value per remaining share, but only if the bank's assets and credit reserves are sound.
That qualification matters because Bank OZK has a large commercial real estate and construction-lending franchise. Management said Real Estate Specialties Group repayments approached $10 billion over four quarters, reducing concentration. It expected construction loans to fall below the relevant concentration guideline around year-end or early 2027.
Credit indicators were not uniformly benign. Special-mention loans increased, and the bank charged off $22 million on a Seattle office property. Special mention is not the same as nonperforming, but it identifies loans that require closer monitoring. Management said reserves had been built before the charge-off and warned that additional problem assets could emerge.
The dividend record is therefore supported by arithmetic rather than tradition alone. A payout near one-third of earnings, steady quarterly profitability and retained capital give the board room for small increases.
The limit is credit. If losses in office, life-science or other construction exposures rise faster than allowances, earnings and capital will absorb the damage before the dividend. Investors should watch special-mention balances, charge-offs, reserve coverage and the pace of RESG repayments alongside the next one-cent increase.
Bank OZK is scheduled to report third-quarter results after the market close on Oct. 20. That release will provide fresher evidence than the dividend history about whether the yield remains comfortably funded.
Novavax's Selloff Puts the Sanofi Partnership Under the Microscope

Novavax shares fell 12% on Oct. 16, a steeper drop than the broader biotechnology market and slightly worse than Moderna's decline. The move put attention back on the company's partner-led model rather than a single new clinical failure.
Sanofi now leads commercial activity for Nuvaxovid in major markets, including the United States, and has expanded the protein-based COVID-19 vaccine into Germany, Canada and other countries for the 2026 to 2027 season. Novavax supplies product during the transition and earns royalties on Sanofi sales.
The arrangement gives Novavax distribution and regulatory reach it could not reproduce cheaply on its own. It also changes the character of the investment. Revenue depends on a partner's launch priorities, demand forecasting and development timetable.
Novavax said it is eligible for royalties in the high teens to low twenties as a percentage of Sanofi's global net Nuvaxovid sales. It could also receive up to $350 million of Phase 3 and commercial milestones tied to Sanofi's influenza and COVID-19 combination products. New vaccines using Matrix-M can generate additional milestones and mid-single-digit royalties.
Those are contingent economics, not booked revenue. Milestones require specified development or commercial events, and royalties depend on actual sales. The company did not provide guidance for those categories in its full-year revenue framework, underscoring their uncertainty.
The Matrix-M adjuvant broadens the thesis beyond seasonal COVID-19 demand. A January agreement gave Pfizer a non-exclusive license to use Matrix-M in up to two disease areas, with a $30 million upfront payment, up to $500 million of additional milestones and high mid-single-digit royalties on resulting products. Pfizer controls development and commercialization, while Novavax supplies the adjuvant.
That capital-light structure can produce attractive margins if partners succeed. It can also make quarterly results lumpy and reduce management's control over timing. An early C. difficile program adds optionality but is not yet large enough to anchor the valuation.
The selloff therefore reflects a real debate. Novavax has lowered the cost of running a global vaccine franchise by handing commercial work to larger companies. In exchange, it has accepted partner concentration and less visibility. Investors need evidence from Sanofi's vaccine sales, realized royalties and milestone progression, not only the maximum payments listed in partnership agreements.
Latest comments