



SPYI Pays More Than JEPI, but the Extra Income Changes the Risk

A $1.08 million SPYI position produces about $52,000 more annualized cash flow than JEPI at recent distribution rates, but return-of-capital treatment, technology concentration and variable option income make the headline yield an incomplete comparison.
Moving $1.08 million from the JPMorgan Equity Premium Income ETF to the NEOS S&P 500 High Income ETF would raise annualized distributions by roughly $52,104 using October 16 prices and each fund's latest monthly payment. The calculation rises from about $77,569 for JEPI to $129,673 for SPYI.
That difference is real arithmetic, but it is not the same as a guaranteed improvement in total return. Both funds use options to generate monthly cash flow, and both can change their distributions. The main investment question is what an investor gives up to receive SPYI's higher current payout.
Two different income engines
JEPI combines a diversified portfolio of large U.S. companies with an options overlay implemented partly through equity-linked notes. JPMorgan's September 30 fact sheet reported a 12-month rolling distribution yield of 8.06% and described the strategy as seeking monthly income with less volatility than the broad equity market. Its monthly payment has varied, including $0.34134 in October versus $0.44761 in May.
SPYI holds the S&P 500 near index weights and sells S&P 500 index options. That structure leaves it more exposed to mega-cap technology than JEPI. NEOS also states that its distributions have been classified as return of capital and may include option premiums, dividends, capital gains and interest.
Return of capital is not automatically destructive. For tax purposes it generally reduces an investor's cost basis rather than being immediately taxed as ordinary income. But it can include a return of the investor's own principal, so the distribution rate should not be read as an earnings yield. NEOS warns that monthly distributions are not guaranteed and may fluctuate.
What the $52,104 difference does not show
The comparison annualizes one recent payment. JEPI's trailing 12-month distributions produced a higher rate than its forward figure, while SPYI's recent payments were steadier. Different measurement windows can therefore change the apparent gap.
Portfolio exposure matters too. SPYI's index-like holdings carry more concentration in Apple, Microsoft and Amazon, while JEPI's active stock portfolio is spread more evenly. A retiree choosing between them is deciding among current cash flow, tax treatment, market participation and volatility, not simply picking the larger percentage.
The higher SPYI distribution can be useful for investors who understand its source and accept the exposure. It should be evaluated alongside changes in net asset value and total return, because a monthly payment alone does not show whether capital is being preserved.
Continue your JEPI research
Related News

Franklin's Bitcoin DRIP ETFs Turn Stock Dividends Into Crypto
Franklin Templeton's new FBEQ and FIBT ETFs begin with 5% bitcoin exposure and redirect stock dividends into bitcoin. Low headline fees mask a structure that adds crypto volatility, derivative risk and potential tracking differences.

Record SOXL and TQQQ Inflows Put Triple Leverage to the Test
Investors poured billions into SOXL and TQQQ during an AI selloff. The flows show aggressive dip buying, but daily leverage can magnify losses and path dependence.

QQQM Saves $30 per $100,000, but Switching From QQQ Can Cost More
QQQ and QQQM track the same Nasdaq-100 Index, but QQQM charges three basis points less. Taxes, options liquidity and account type determine whether switching makes sense.
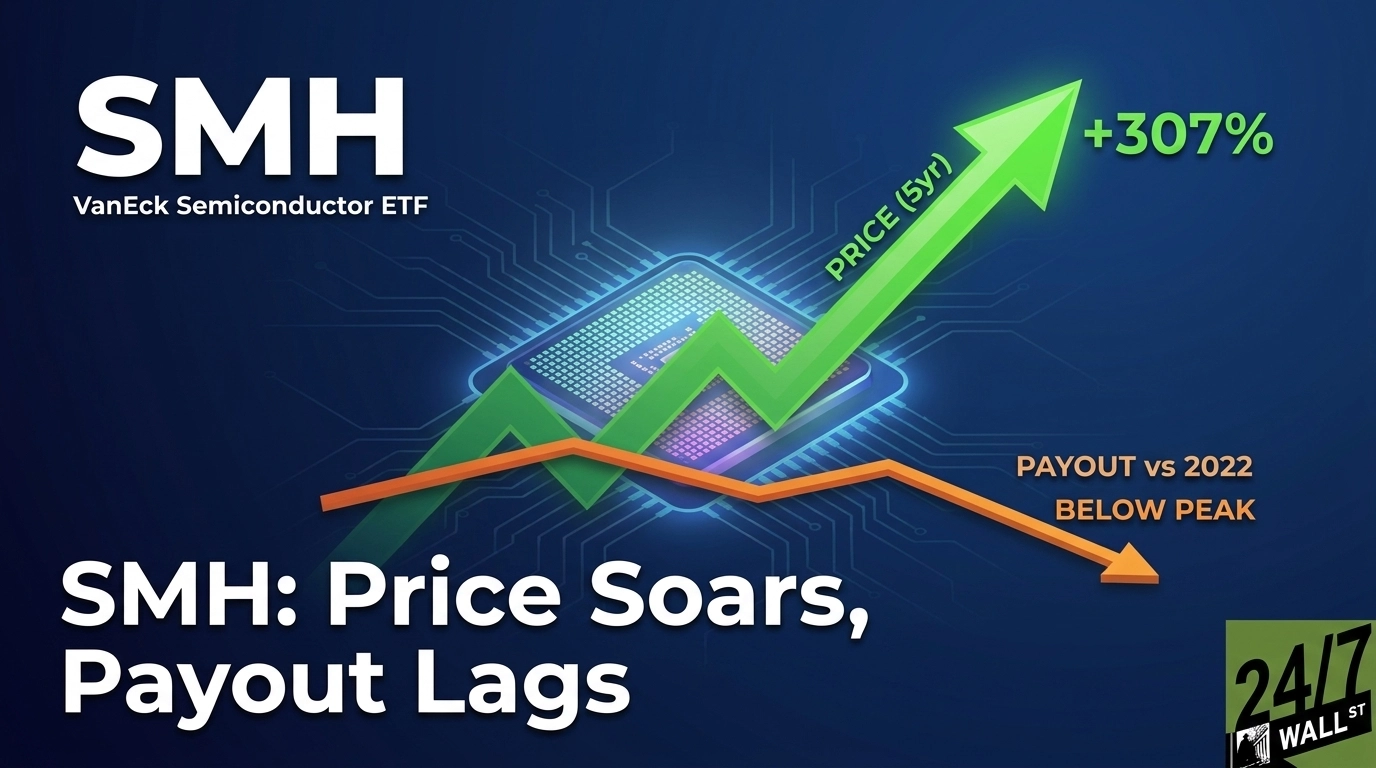
SMH's 0.2% Yield Shows What Semiconductor Investors Are Buying
SMH has delivered strong price gains while its annual distribution remains below its split-adjusted 2022 level. The contrast reflects a concentrated portfolio built for semiconductor growth, not meaningful current income.

Super Micro's 61% Slide Exposes an Unpriced Cost of Indexing
VOO's rules required exposure to Super Micro after its S&P 500 inclusion, before a 61% decline. The damage to a broad fund was small, but the episode shows how index timing works.
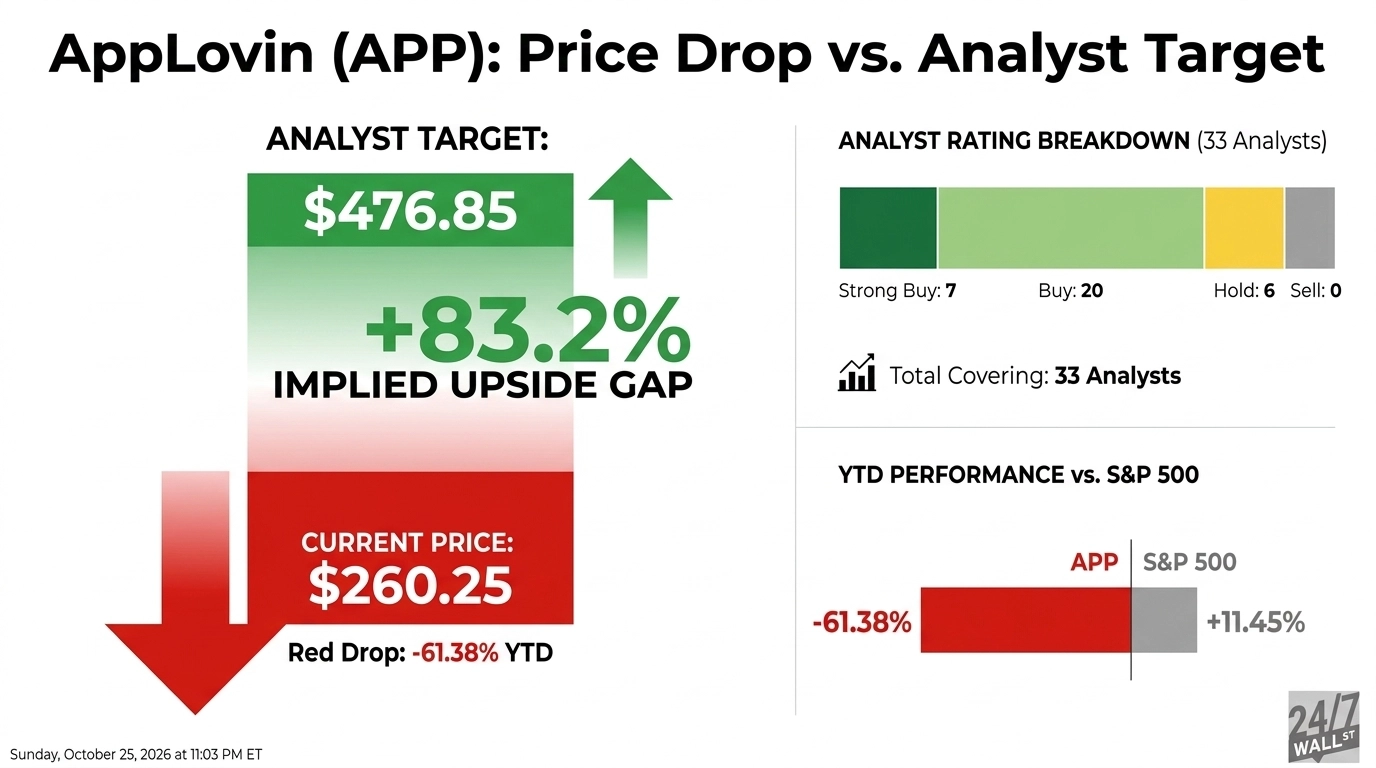
AppLovin's 61% Slide Turns Its Next Quarter Into a Model Test
AppLovin's second-quarter revenue and cash flow still grew rapidly, yet a small revenue miss and slower model improvements changed the market's confidence. The November 4 report now carries unusual weight.
Alibaba's Cloud Growth Cannot Yet Offset Its Commerce and Cash Costs
Alibaba's 31% share-price decline in 2026 looks like a broad retreat from Chinese internet stocks, but the company's latest results show a sharper internal divide. Its cloud business is growing quickly, while core commerce and the cash cost of artificial intelligence investment remain meaningful constraints.
On October 26, 24/7 Wall St. reported Alibaba's U.S.-listed shares at $99.91, down 31% for the year. The KraneShares CSI China Internet ETF and PDD Holdings were each down about 32%, while JD.com was down 9% and the S&P 500 was up 12%. Those comparisons support the view that sector sentiment matters, but they do not show that Alibaba's businesses are standing still.
For the June 2026 quarter, Alibaba reported revenue of RMB268.95 billion, up 9% from a year earlier. AI Cloud and Compute Services revenue rose 45% to RMB48.44 billion, while AI-related product revenue reached RMB12.38 billion and posted triple-digit growth for a twelfth consecutive quarter. Segment adjusted EBITA increased 133% to RMB5.63 billion. Those figures provide the clearest evidence that cloud is becoming a larger and more profitable part of the group.
Commerce was less convincing. China e-commerce revenue fell 8%, and customer management revenue declined 7%. Alibaba said customer management revenue would have risen 1% on a like-for-like basis without the contra-revenue effect of a new business development program. China Quick Commerce revenue rose 45%, but that growth came alongside continued investment in user experience and technology.
The consolidated numbers show the cost of the transition. Reported operating income fell 57% to RMB15.16 billion, and net income declined 75% to RMB10.44 billion. Adjusted EBITA fell 30% to RMB27.33 billion. Free cash flow was an outflow of RMB44.67 billion, compared with an RMB18.82 billion outflow a year earlier, mainly because cloud infrastructure spending increased. Quarterly capital expenditure rose 75% to RMB67.68 billion.
Alibaba still had RMB474.51 billion of cash and other liquid investments at the end of June. That balance gives management room to fund AI infrastructure, but the spending has to translate into durable returns. The new AI Labs and Applications segment reported an adjusted EBITA loss of RMB13.86 billion, more than four times the RMB3.22 billion loss a year earlier, largely because of AI investment and Qwen app inference costs.
The investment question is therefore not simply whether Alibaba is cheap after falling with its peers. It is whether 45% cloud growth and improving cloud profitability can eventually outweigh slower commerce, heavy capital expenditure and rising application-layer losses. A sustained gap between Alibaba and the broader China internet index would be useful market evidence, but the stronger proof will come from cash flow and consolidated profit.
Cyprus' First Gas Project Turns a Discovery Into a 2028 Export Plan

Cyprus has moved closer to producing natural gas for the first time. Eni signed infrastructure contracts worth up to $1.8 billion for the Cronos field, turning a discovery in Block 6 of Cyprus' exclusive economic zone into a construction program aimed at first production in 2028.
Eni operates the field with a 50% interest, while TotalEnergies owns the other 50%. The companies approved the development in July. Eni says Cronos contains more than 3 trillion cubic feet of gas and could produce as much as 500 million cubic feet a day once operations stabilize. At that plateau rate, annual output would be about 182.5 billion cubic feet, a BTI calculation that helps show the project's scale but does not account for ramp-up, downtime or reservoir decline.
The export route is central to the economics. Gas will travel by subsea pipeline to facilities linked to Eni's Zohr field in Egypt, then move to the Damietta liquefied natural gas plant for shipment to international markets, mainly Europe. Reusing Egyptian processing and liquefaction infrastructure should reduce the amount of new construction compared with building a complete export system in Cyprus. It also makes the project dependent on cross-border coordination and the availability of the Egyptian network.
The contracts cover the equipment and connections needed to make that route work. Baker Hughes is set to supply subsea production systems; Dalmine will work on export and transfer pipelines; TechnipFMC will handle flexible production lines; and McDermott will transport, install and commission subsea equipment. Oceaneering, CMHI, Petrojet and Saipem also have roles in controls, the floating unit, the Egyptian onshore pipeline and drilling.
For Eni and TotalEnergies investors, the signing is more important as evidence of execution than as immediate earnings. Revenue from gas sales is not expected before production starts, and the current target still depends on completing a complex offshore project on time. Commercial agreements, export capacity, safety performance and regional conditions will determine how much of the resource ultimately reaches paying customers.
Cronos is therefore a regional infrastructure story as much as a reserve story. Cyprus gains a route to monetize its first gas field, Egypt uses existing assets, and Eni and TotalEnergies can develop a deepwater discovery without creating a standalone liquefaction system. The next proof point is physical progress toward first-half 2028 production, not the headline value of the contracts alone.
Meta's $135 Billion AI Budget Shifts Attention to Amphenol

Meta's artificial intelligence budget is now large enough to shape results well beyond Meta itself. Aptus Capital Advisors portfolio manager David Wagner argues that the spending should be viewed from both sides: capital expenditure for Meta becomes revenue for the companies supplying data centers, networking equipment and cloud capacity.
That argument gained firmer numerical support in Meta's third-quarter results. The company spent $34.91 billion on capital expenditures, including principal payments on finance leases, during the quarter and narrowed its full-year 2026 forecast to $135 billion to $145 billion. Meta also said its AI investments are already lifting advertising revenue through better recommendations, engagement and monetization.
The cost is visible too. Meta generated $32.79 billion of operating cash flow in the third quarter but reported negative free cash flow of $2.12 billion. It ended September with $82.45 billion of cash, cash equivalents and marketable securities. The company has since said it plans to fund its infrastructure with a mix of operating cash flow, investment-grade debt, strategic partnerships and equity capital. That makes Wagner's point about debt capacity more specific: Meta has substantial resources, but the buildout is big enough to require several funding channels.
Amphenol is one way investors can express the supplier side of that thesis. The company sells connectors, cables and related systems into the IT and data communications market, making it exposed to the physical expansion of AI infrastructure. Wagner named Amphenol alongside Amazon and Meta among stocks he favors. The connection is economically plausible, but it is not a guarantee that every dollar of Meta spending reaches Amphenol. Customer mix, component pricing, competition and the shift between copper and optical connections will determine how much of the industry budget becomes Amphenol revenue.
The next company-specific check arrives quickly. Amphenol is scheduled to report third-quarter results on October 28. Investors can then compare the broad supplier thesis with actual IT and data communications sales, orders and guidance. Meta's spending plan supports demand, while Amphenol's own results will show how much of that demand it is capturing.
Affirm's Q1 Setup Turns on GMV Growth Above Guidance

Affirm enters its November 5 earnings report with analysts expecting growth above management's own starting point, but the gap between expectations and guidance is now a source of risk as well as potential upside.
Morgan Stanley lowered its Affirm price target to $79 from $82 and kept an Equal Weight rating, according to the original report. The firm still expects fiscal first-quarter gross merchandise volume, or GMV, to grow about 34%, compared with roughly 31% at the high end of the company's implied outlook. The report says investors may be positioned for growth closer to 37%, which means a result above management's range could still disappoint if it falls short of the market's unofficial bar.
A second firm took a more bullish position. Monness Crespi initiated coverage with a Buy rating and a $90 target, arguing that buy-now-pay-later providers and neobanks have taken a larger share of spending and lending. The next phase depends on customers using the services more often and on changes in customer mix, not simply adding more users.
Affirm's own outlook calls for first-quarter GMV of $13.7 billion to $14.0 billion and revenue of $1.19 billion to $1.22 billion. The original report cites Fiscal.ai consensus revenue of $1.21 billion and earnings of $0.38 per share, compared with $0.23 a year earlier. Revenue consensus therefore sits inside the company's range, while the more demanding debate is about GMV growth and profitability.
The company also expects a GAAP operating margin of 11.5% to 13.5% and an adjusted operating margin of 28% to 30%. Its outlook assumes a promotional event with a large merchant will not repeat and that another merchant's move to its own wallet will remain a year-over-year headwind for part of the quarter. Affirm also expects short-term benchmark rates to be higher in fiscal 2027 than in fiscal 2026, adding pressure to funding economics.
Affirm reports after the market closes on November 5, with its conference call scheduled for 5 p.m. ET. A clean beat requires more than strong transaction volume. Investors should compare GMV with revenue less transaction costs, which the company guides to $575 million to $590 million, and check whether credit performance and funding costs support the margin forecast.
Amazon's AWS Forecast Raises the Bar Ahead of Q3 Earnings
Amazon's third-quarter report on October 29 has a narrow test at its center: can Amazon Web Services accelerate again without making the returns on the company's AI spending harder to see? Bank of America's forecast says the cloud business can clear that bar, but the rest of the quarter leaves little room for a weak margin result.
The bank forecasts Amazon revenue of $202.0 billion and operating income of $26.4 billion. The revenue estimate is just below the $202.2 billion consensus cited in the original report, while operating income is slightly above the cited $26.1 billion consensus. Amazon's own guidance calls for revenue of $197 billion to $202 billion and operating income of $22.5 billion to $26.5 billion. In other words, the analyst's case sits near the top of management's ranges rather than assuming a broad companywide beat.
Bank of America expects AWS revenue to grow 40% from a year earlier, two percentage points above the consensus rate cited in its note. It estimates AWS will add roughly $4 billion of revenue from the second quarter and produce a 39% operating margin. The note attributes that growth to added capacity, price increases, AI laboratory contracts and enterprise demand for inference, while greater use of Amazon's Trainium chips and Bedrock platform could help absorb higher depreciation.
The starting point is already strong. In the second quarter, AWS sales rose 37% to $42.2 billion and AWS operating income reached $16.6 billion, according to Amazon. Advertising grew 26%, and total operating income rose to $27.5 billion. Yet Amazon's trailing free cash flow was a $7.6 billion outflow after property and equipment spending increased by $66.1 billion, mainly for AI infrastructure. That gap between reported operating profit and cash generation is the central counterweight to the cloud growth story.
The retail and advertising businesses could make the comparison less clean. Bank of America expects North American retail growth to slow to 6%, while advertising growth eases to 15% because Prime Day timing becomes less favorable. It forecasts fourth-quarter revenue guidance of $239 billion to $246 billion, with a midpoint below the consensus cited in the note, and operating income guidance of $29 billion to $34 billion.
A 40% AWS result would be encouraging, but investors also need evidence that new capacity is being used efficiently. The most revealing figures will be AWS operating margin, total capital spending, depreciation and the fourth-quarter profit range. Rapid cloud growth matters more if it can convert Amazon's unusually heavy AI investment into durable cash returns.
Latest comments