


 Be The Investor Research
Cava’s 500th Restaurant Raises the Bar for Its Expansion Economics

Cava reached 500 restaurants and says new locations still generate more than $3 million in annualized sales. The milestone supports its 1,000-unit goal, but returns on new stores matter more than the count alone.
Cava has opened its 500th restaurant less than a year after reaching $1 billion in annual sales, putting the chain ahead of schedule toward its target of at least 1,000 locations by 2032.
The milestone matters because the restaurant industry is expanding unevenly. High operating costs and softer consumer demand have forced closures at weaker brands, while Cava continues entering new markets and building density in cities where it already operates.
Growth is spreading beyond the coasts
Cava’s 500th restaurant opened in Minneapolis, extending a Midwest push that began with Chicago. Management previously said up to 30% of new development targets entirely new markets, with most remaining openings concentrated in emerging and growth markets.
That approach balances two goals. New regions expand the addressable market, while denser clusters can improve brand awareness, delivery economics and marketing efficiency.
The company’s own release said new-restaurant productivity remains above 100% and that new stores generate more than $3 million in average annualized sales. Those figures support the expansion case, although investors still need restaurant-level margins and payback periods to judge returns on capital.
The milestone count is not the thesis
Other chains also reached large development marks. Dave’s Hot Chicken passed 500 locations, Freddy’s opened its 600th and Chipotle reached 1,500 Chipotlanes. The comparison shows that unit growth alone does not distinguish a winner. Ownership model, store economics and capital requirements differ significantly.
Cava plans 75 to 77 openings in 2026. Rapid construction can pressure labor, real estate and pre-opening expenses before new stores mature. It can also increase execution risk when the company enters markets with lower brand awareness.
The next evidence is same-restaurant sales, new-unit margins and the pace at which recently opened stores reach mature volumes. Reaching 500 locations confirms that Cava can build quickly. Sustaining attractive returns while moving toward 1,000 will determine whether the expansion creates shareholder value.
Continue your CMG research
Related News

LKQ's Guidance Withdrawal Is the Real Signal in a Three-Stock Selloff
T-Mobile, LKQ and Chipotle reached multiyear lows for different reasons. LKQ's withdrawn guidance and Europe disruption carry the clearest company-specific evidence, while the other moves depend on still-unresolved competitive and earnings questions.

Oklo's 63% Drop Leaves Licensing and Funding as the Real Tests
Oklo's selloff has reduced expectations, but the company still needs regulatory progress, project financing and binding customer commitments before its nuclear thesis becomes operating cash flow.

Qualcomm's Selloff Puts Its Diversification Plan on Trial
Qualcomm's 13% monthly decline reflects handset and Apple exposure, while management is asking investors to look toward automotive, industrial computing and a new data-center business.

Devon's Rally Now Depends on Turning Merger Savings Into Cash
Devon's cash generation improved before its Coterra merger, but a negative reported free-cash-flow quarter makes delivery of $1 billion in promised annual synergies the next test.

Verizon's Customer Rebound Is Real, but the FCC Vote Could Reset Wireless Risk
Verizon added 406,000 postpaid phones and raised guidance, proving its turnaround has operating traction. An October 29 FCC vote on satellite spectrum could still reshape the long-term competitive risk.

Incyte's $181 Scenario Requires Revenue to Nearly Double Without a Margin Collapse
A three-year Incyte scenario points to 56% upside, but it assumes 22.9% annual revenue growth and a still-high net margin. One-time Opzelura benefits make the starting point less clean.
SoundHound's Cash Runway Exceeds One Year, but Dilution Remains the Cost

SoundHound AI ended June with $203 million of cash and cash equivalents, enough to cover about five and a half quarters if free cash flow stayed at the second-quarter burn rate of $36.9 million. That calculation is useful, but it is not a forecast. The LivePerson acquisition closed after the quarter, and both spending and the share count changed with the transaction.
The operating picture is moving in two directions. Second-quarter revenue rose 45% from a year earlier to $61.9 million, while the source data shows free cash outflow increased about 49% to $36.9 million. Revenue therefore grew rapidly, but the latest quarter did not yet show operating leverage in cash terms.
SoundHound's official release reported no debt at June 30, correcting the source article's reference to $5.44 million of debt. The company used $60.0 million of cash in operating activities during the first six months of 2026 and ended the period with $203 million in cash. The company also raised its full-year revenue outlook at the time to $230 million to $260 million, before incorporating LivePerson.
The runway calculation is straightforward: $203 million divided by $36.9 million equals 5.5 quarters. It assumes no additional financing, no change in working capital and no improvement or deterioration in quarterly burn. It also treats the June balance as fully available to fund operations. Investors should not extend that estimate to late 2027 without seeing the combined company's opening balance sheet and integration costs.
Shareholders have financed much of SoundHound's expansion through equity rather than borrowing. The source analysis calculates that the diluted share count rose 32.2% over the two years to June 2026. For the LivePerson deal, official closing documents verify a mix of cash and SoundHound stock, including 0.4673 SoundHound shares plus $3.31 in cash for each eligible LivePerson share. The exact post-deal diluted share count should be taken from SoundHound's next filing rather than inferred from preliminary transaction estimates.
Management said general and administrative expenses rose 43% in the June quarter, driven largely by legal, advisory and other acquisition costs. It also said it was optimizing cloud spending, consolidating older systems and developing more of its own language-model and speech technology. Those actions may improve margins, but they remain management plans until cash outflow falls.
The November 5 report is therefore more important than another revenue-growth headline. Investors need the combined cash balance, acquisition and restructuring costs, the new diluted share count, customer retention and a quarterly cash-flow figure that can be compared with the $36.9 million pre-deal burn. SoundHound has more than a year of runway at the old pace, but only a sustained reduction in burn can prevent growth from requiring further dilution.
AppLovin's 61% Slide Turns Its Next Quarter Into a Model Test
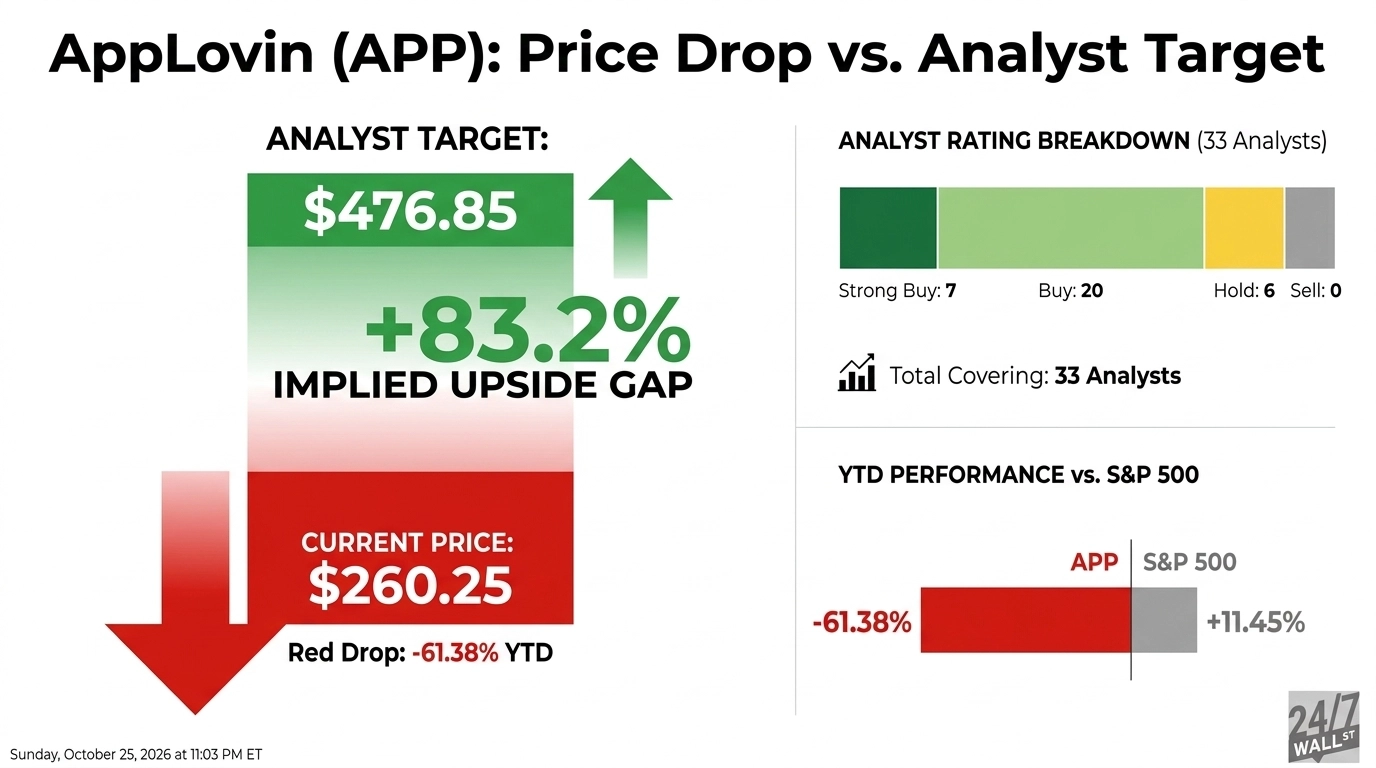
AppLovin's second-quarter results were strong in absolute terms, yet a small miss was enough to deepen a 2026 share-price collapse. The stock traded at $260.25 on October 26, according to 24/7 Wall St., down 61.38% for the year and close to its 52-week low. That reaction makes the next quarter a test of whether the setback was timing or a change in the growth engine.
The official results show why investors have not abandoned the company. Revenue rose 53% from a year earlier to $1.924 billion, net income increased 55% to $1.267 billion, and adjusted EBITDA climbed 58% to $1.614 billion. AppLovin generated $863.3 million of free cash flow and spent $551.3 million on share repurchases and tax withholding tied to vested awards.
The problem was the gap between a fast-growing business and even higher expectations. The source report says revenue missed estimates by 0.94%, while adjusted EBITDA fell below the guided range as computing costs rose. Chief Executive Adam Foroughi attributed the quarter's slower progress to the timing of model improvements, with the next meaningful upgrade arriving after quarter-end. Because AppLovin's AXON advertising system depends on repeated model gains, investors treated the timing issue as evidence that growth may be less predictable.
Management's third-quarter outlook points to continued expansion. The company guided for revenue of $2.055 billion to $2.085 billion and adjusted EBITDA of $1.710 billion to $1.740 billion, both with an 83% adjusted EBITDA margin at the midpoint and endpoints stated by the company. Meeting that range would show that the model improvement deployed after June is contributing to revenue. Missing it would strengthen the argument that the second-quarter stumble was not isolated.
The bullish case goes further. The source cites a $790 target from UBS analyst Stephen Ju, compared with a $476.85 average target across 33 analysts. Ju's view rests on AXON monetization, expansion from mobile gaming into e-commerce advertising, and free cash flow that can support buybacks. Those targets are opinions, not operating evidence, and even the consensus target implies a recovery that requires sustained execution.
There are also issues outside the quarterly model cadence. A securities class action challenges statements about model improvements, while the source says an SEC inquiry ended without a recommendation for enforcement action. The legal matters should not be treated as interchangeable. One remains active; the other, according to the report, closed without recommended action.
AppLovin is scheduled to report third-quarter results on November 4. Revenue, adjusted EBITDA margin and evidence of advertiser expansion will matter more than any price target. The company has already demonstrated high profitability and cash generation. It now has to show that those results can keep compounding when model upgrades do not arrive on a perfectly smooth schedule.
Alibaba's Cloud Growth Cannot Yet Offset Its Commerce and Cash Costs
Alibaba's 31% share-price decline in 2026 looks like a broad retreat from Chinese internet stocks, but the company's latest results show a sharper internal divide. Its cloud business is growing quickly, while core commerce and the cash cost of artificial intelligence investment remain meaningful constraints.
On October 26, 24/7 Wall St. reported Alibaba's U.S.-listed shares at $99.91, down 31% for the year. The KraneShares CSI China Internet ETF and PDD Holdings were each down about 32%, while JD.com was down 9% and the S&P 500 was up 12%. Those comparisons support the view that sector sentiment matters, but they do not show that Alibaba's businesses are standing still.
For the June 2026 quarter, Alibaba reported revenue of RMB268.95 billion, up 9% from a year earlier. AI Cloud and Compute Services revenue rose 45% to RMB48.44 billion, while AI-related product revenue reached RMB12.38 billion and posted triple-digit growth for a twelfth consecutive quarter. Segment adjusted EBITA increased 133% to RMB5.63 billion. Those figures provide the clearest evidence that cloud is becoming a larger and more profitable part of the group.
Commerce was less convincing. China e-commerce revenue fell 8%, and customer management revenue declined 7%. Alibaba said customer management revenue would have risen 1% on a like-for-like basis without the contra-revenue effect of a new business development program. China Quick Commerce revenue rose 45%, but that growth came alongside continued investment in user experience and technology.
The consolidated numbers show the cost of the transition. Reported operating income fell 57% to RMB15.16 billion, and net income declined 75% to RMB10.44 billion. Adjusted EBITA fell 30% to RMB27.33 billion. Free cash flow was an outflow of RMB44.67 billion, compared with an RMB18.82 billion outflow a year earlier, mainly because cloud infrastructure spending increased. Quarterly capital expenditure rose 75% to RMB67.68 billion.
Alibaba still had RMB474.51 billion of cash and other liquid investments at the end of June. That balance gives management room to fund AI infrastructure, but the spending has to translate into durable returns. The new AI Labs and Applications segment reported an adjusted EBITA loss of RMB13.86 billion, more than four times the RMB3.22 billion loss a year earlier, largely because of AI investment and Qwen app inference costs.
The investment question is therefore not simply whether Alibaba is cheap after falling with its peers. It is whether 45% cloud growth and improving cloud profitability can eventually outweigh slower commerce, heavy capital expenditure and rising application-layer losses. A sustained gap between Alibaba and the broader China internet index would be useful market evidence, but the stronger proof will come from cash flow and consolidated profit.
Meta's $135 Billion AI Budget Shifts Attention to Amphenol

Meta's artificial intelligence budget is now large enough to shape results well beyond Meta itself. Aptus Capital Advisors portfolio manager David Wagner argues that the spending should be viewed from both sides: capital expenditure for Meta becomes revenue for the companies supplying data centers, networking equipment and cloud capacity.
That argument gained firmer numerical support in Meta's third-quarter results. The company spent $34.91 billion on capital expenditures, including principal payments on finance leases, during the quarter and narrowed its full-year 2026 forecast to $135 billion to $145 billion. Meta also said its AI investments are already lifting advertising revenue through better recommendations, engagement and monetization.
The cost is visible too. Meta generated $32.79 billion of operating cash flow in the third quarter but reported negative free cash flow of $2.12 billion. It ended September with $82.45 billion of cash, cash equivalents and marketable securities. The company has since said it plans to fund its infrastructure with a mix of operating cash flow, investment-grade debt, strategic partnerships and equity capital. That makes Wagner's point about debt capacity more specific: Meta has substantial resources, but the buildout is big enough to require several funding channels.
Amphenol is one way investors can express the supplier side of that thesis. The company sells connectors, cables and related systems into the IT and data communications market, making it exposed to the physical expansion of AI infrastructure. Wagner named Amphenol alongside Amazon and Meta among stocks he favors. The connection is economically plausible, but it is not a guarantee that every dollar of Meta spending reaches Amphenol. Customer mix, component pricing, competition and the shift between copper and optical connections will determine how much of the industry budget becomes Amphenol revenue.
The next company-specific check arrives quickly. Amphenol is scheduled to report third-quarter results on October 28. Investors can then compare the broad supplier thesis with actual IT and data communications sales, orders and guidance. Meta's spending plan supports demand, while Amphenol's own results will show how much of that demand it is capturing.
Apparel Selloff Masks Three Different Turnaround Problems
A broad retail selloff pushed Lululemon and Under Armour down about 4% on October 23, while Nike fell roughly 2%. The similar share moves concealed three different operating problems, and investors should not treat the group as a single bet on consumer spending.
The macro backdrop was not uniformly weak. The U.S. Census Bureau estimated September retail and food-services sales at $745.0 billion, up 0.8% from August and 6.3% from a year earlier. The report was adjusted for seasonal and trading-day effects but not for price changes. With the SPDR S&P Retail ETF down about 2% that day and no fresh announcement from the three companies, the stock moves looked more like a repricing of discretionary risk than a response to new company results.
Lululemon has the clearest near-term demand problem. Second-quarter revenue fell 4% to $2.4 billion, Americas revenue declined 8%, and Americas comparable sales dropped 12%. Reported gross margin rose 200 basis points to 60.5%, but a $134.5 million tariff refund added 560 basis points. Operating margin still declined 190 basis points to 18.8%. Management guided third-quarter revenue to $2.29 billion to $2.32 billion, a 10% to 11% decline, and expects full-year revenue to fall 5% to 7%.
Under Armour's weakness is spread across channels and categories. Its first-quarter fiscal 2026 revenue declined 4% to $1.1 billion, with North America down 5%, wholesale down 5% and direct-to-consumer revenue down 3%. Footwear fell 14%, a sharper contraction than the 1% decline in apparel. The company reported $13 million of restructuring charges and held $911 million of cash, including $400 million raised in senior notes to help address $600 million of notes due in June 2026.
Nike is further along in parts of its turnaround, but the recovery is uneven. Fiscal first-quarter 2027 revenue fell 4% to $11.2 billion, while North America grew 2%. Performance categories grew at a high-single-digit rate, helped by running and global football, but Sportswear, Jordan and Greater China remained material drags. Nike ended the quarter with $8.4 billion in cash and short-term investments, giving it more financial room than the other two companies.
The October 23 selloff therefore did not prove that shoppers had suddenly stopped spending. It highlighted different tests: Lululemon must stabilize Americas comparable sales without relying on one-time tariff refunds, Under Armour must make restructuring produce durable demand and margin improvement, and Nike must turn strength in performance products into a broader brand recovery.
Latest comments