


FDVV ETF
Sign in to calculate the ETF estimate.
Fidelity High Dividend ETF (FDVV) News
The latest Fidelity High Dividend ETF (FDVV) news in one feed: fund flows, rebalancing, price analysis and market-moving headlines, curated by BTI.
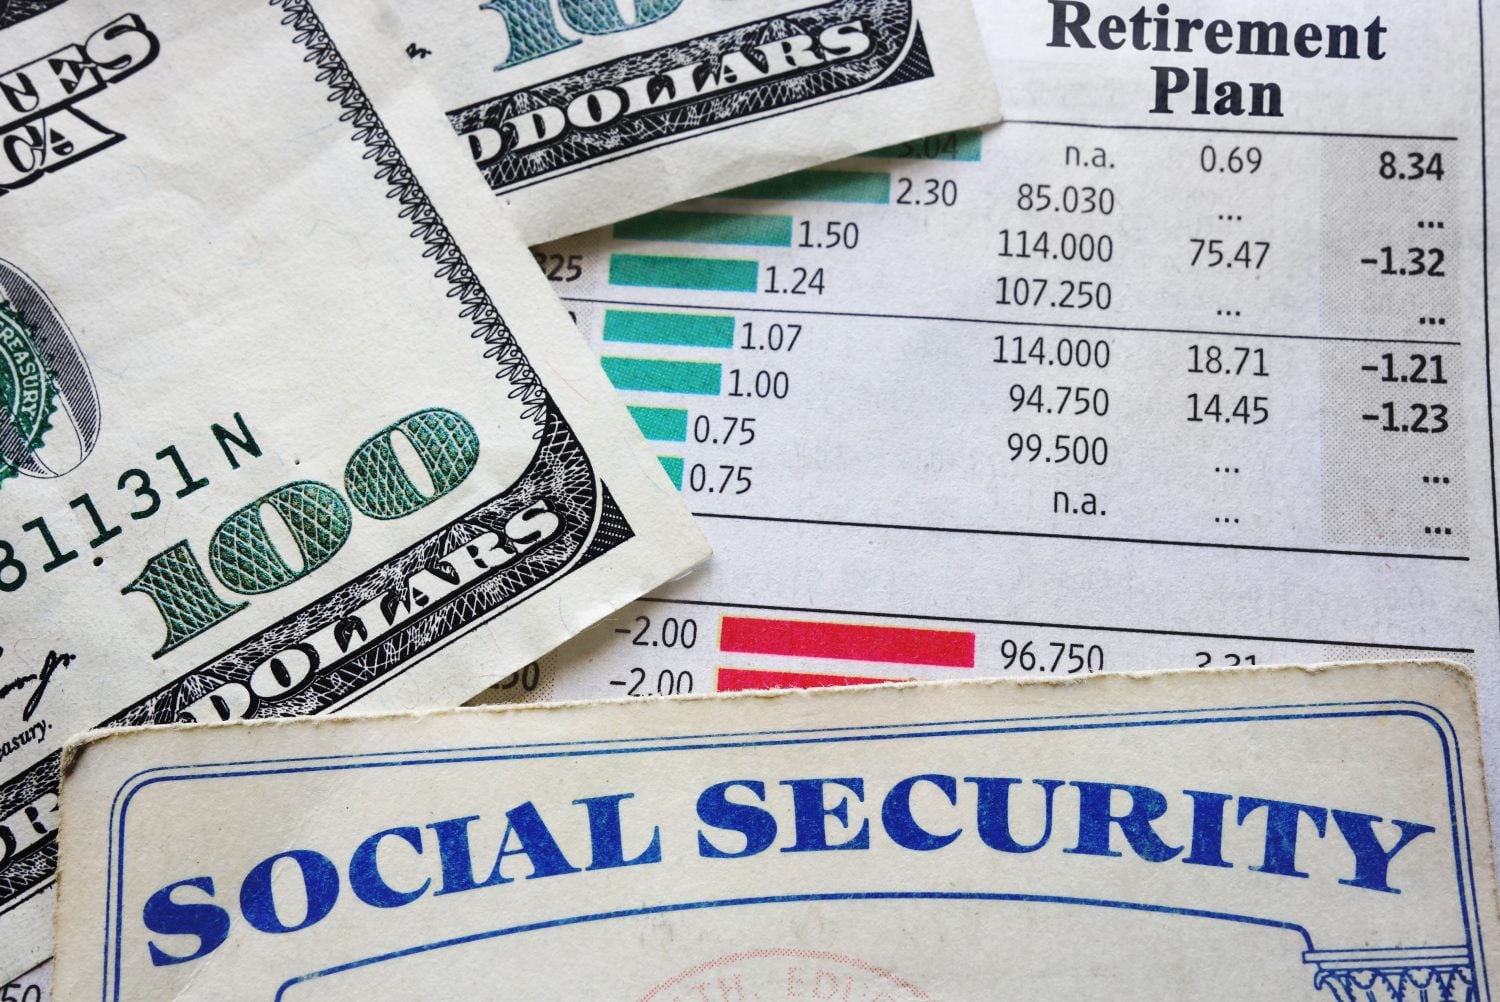
A 3.6% Social Security COLA Is Certain; ETF Income Is Not
The 2027 Social Security adjustment adds about $75 a month for an average retiree. JEPI, SCHD and FDVV paid more on $100,000, but those distributions carry market and strategy risk.
The 2027 Social Security COLA Is 3.6%. Dividend ETFs Cannot Replace It
Social Security benefits will rise 3.6% in 2027, about $75 monthly for the average retiree. Dividend ETFs can supplement income, but their payouts fluctuate and principal remains exposed to markets.
Social Security's 3.6% COLA and the Real Risks of Dividend ETFs
The 2027 Social Security adjustment adds about $75 monthly for an average retiree. JEPI, SCHD and FDVV can provide more cash income, but payouts vary and principal remains exposed to market losses.

NOBL's Dividend Discipline Came With a Return Trade-Off
A ten-year comparison found six popular dividend ETFs beat NOBL, but the result reflects different portfolio rules. NOBL still offers equal-weight exposure to companies with at least 25 years of dividend growth.
QYLD vs. FDVV: High Monthly Income Came With a Long-Term Cost
A ten-year total-return comparison shows Fidelity's dividend ETF outpacing QYLD despite the covered-call fund's larger monthly distributions. The result highlights a basic trade-off: current cash flow versus participation in equity upside.