



DVY Beat PDI on Total Return, but the Funds Solve Different Problems

DVY's ten-year reinvested return far exceeded PDI's, while PDI paid much more cash income. The comparison is useful only after accounting for asset class, leverage, distribution use and tax treatment.
A ten-year performance gap makes a strong headline: $100,000 invested with distributions reinvested grew to about $271,320 in the iShares Select Dividend ETF and $177,640 in the PIMCO Dynamic Income Fund, based on the source's October 17, 2016 starting point. That is a 93.68 percentage-point advantage for DVY.
The comparison is informative, but it is not like-for-like. DVY owns high-dividend U.S. equities and seeks to track an index. PDI is a leveraged closed-end fixed-income fund whose primary objective is current income. Stocks and leveraged credit respond differently to growth, interest rates, defaults and market stress.
Cash flow is where PDI has delivered more. The source calculates that a $100,000 position paid about $18,353 over the trailing 12 months, compared with about $3,363 from DVY. An investor who spent PDI's monthly distributions would not have achieved the reported reinvested total return, but the cash may have served the portfolio's intended purpose. DVY's quarterly payments are smaller and expose a retiree to a different sequence of equity-market risk.
Closed-end fund pricing adds another layer. PDI can trade above or below the net asset value of its portfolio, so investor returns reflect both asset performance and changes in the market discount or premium. Its use of leverage can amplify income and losses. Distribution notices also matter because a payout can include income, gains or return of capital.
The practical decision is therefore not which ticker won a historical race. It is whether an investor needs high current cash flow or long-run capital growth, and whether the risks match that goal. A fair comparison should examine net-asset-value return, market-price return, leverage, distribution coverage, taxes and drawdowns. DVY's record favors reinvestors in this period, while PDI's cash flow may remain relevant for income spenders who understand the trade-offs.
Continue your PDI research
Related News

How Much Capital Can Support $7,600 a Month in Retirement?
Generating $91,200 a year may require about $2.61 million at a 3.5% yield, $1.52 million at 6% or $912,000 at 10%. The smaller portfolio carries much greater payout and principal risk.

Treasury Yields Near 5% Change the Dividend Decision for Retirees
Short-term Treasuries offer high contractual income with limited duration risk, while dividend stocks offer potential growth and better tax treatment. The better choice depends on spending horizon, reinvestment risk and tolerance for equity volatility.

A $4,950 Monthly Income Plan Requires More Than Three Headline Yields
A portfolio built from JEPQ, Realty Income and Main Street Capital can generate substantial monthly cash flow, but the target depends on variable distributions, credit conditions, taxes and a large initial investment.

TLT, EDV and VGLT Share Treasury Credit Risk but Not Price Risk
TLT, EDV and VGLT all hold long-term U.S. Treasuries, yet their duration and fees produce materially different volatility. EDV is the most rate-sensitive; VGLT is cheaper and somewhat less extreme.

10x Genomics Led ARK's Q3 Gains While Tesla Dragged Across Funds
ARK's third-quarter attribution shows 10x Genomics as the biggest contributor to ARKG and a major boost to ARKK, while Tesla weighed on three funds. The figures measure portfolio contribution, not standalone stock returns.

SOXQ Beat SMH for One Year, but SMH Still Leads Over Five
SOXQ outperformed SMH over the year through October 2026, while SMH retained a much larger five-year lead. Index design, concentration, taxes and time horizon matter more than the latest winner.
HDV's Five-Year Lead Over NOBL Comes With a Different Bet

A large five-year return gap between HDV and NOBL looks decisive until the comparison is extended to ten years.
The original analysis calculated reinvested total returns of 82.92% for the iShares Core High Dividend ETF and 37.22% for the ProShares S&P 500 Dividend Aristocrats ETF over the five years through October 2026. Over ten years, however, the results were almost tied: 172.65% for HDV and 171.96% for NOBL. The contrast shows how strongly the chosen start date can shape an ETF ranking.
The funds screen for different qualities. HDV seeks exposure to relatively high-dividend U.S. companies and uses Morningstar's dividend-yield-focused index methodology. BlackRock reported an expense ratio of 0.08% and a 30-day SEC yield of about 3.05% at September 30, 2026. NOBL tracks companies in the S&P 500 that have increased dividends for at least 25 consecutive years. ProShares charges 0.35%.
That distinction changes portfolio behavior. HDV can concentrate in mature, cash-generative sectors when their yields are attractive. NOBL's dividend-growth requirement favors durability but can lag when high-yield sectors lead or when its equal-weighted portfolio is out of favor. Neither methodology guarantees better future returns.
Recent performance favored HDV as well. The source comparison put HDV ahead over the prior month, year to date and the trailing year. Investors should still verify current issuer performance because daily market returns and reinvestment assumptions can alter the exact figures.
Yield is only one part of the decision. A higher starting yield may suit an investor who needs current income, while a long record of dividend increases may suit someone emphasizing business resilience and future income growth. Sector weights, valuation, tax consequences and existing holdings can matter more than a recent leaderboard.
Switching after a large run creates another risk. Selling NOBL in a taxable account can realize gains, and buying HDV after a period of outperformance may amount to chasing the sectors that just worked. The nearly identical ten-year outcome is a useful restraint: different strategies can reach similar long-term results through very different market cycles.
DVY Beat JEPI on Five-Year Return, but JEPI Paid More Income

DVY and JEPI are often grouped together as income funds, but their five-year records reflect two very different jobs.
The original comparison calculated that a dividend-reinvested investment in the iShares Select Dividend ETF returned 58.53% over the five years through October 20, 2026, versus 43.22% for the JPMorgan Equity Premium Income ETF. DVY also led over the prior year and in 2026 through that date, while JEPI performed better over the most recent month. These point-to-point figures can change quickly and are not a substitute for issuer-reported month-end performance.
The income comparison went the other way. Based on the distributions used in the original analysis, $100,000 invested for the trailing year generated about $7,992 from JEPI and $3,390 from DVY. JEPI paid monthly and DVY paid quarterly. That gap explains much of JEPI's appeal to investors who need cash flow now.
The funds produce income differently. DVY tracks an index of relatively high-dividend U.S. companies, so its return depends mainly on the stocks it owns and their dividends. JEPI actively owns U.S. large-cap stocks and uses an options-linked strategy to generate additional monthly income. JPMorgan's September 2026 fact sheet reported a 12-month rolling dividend yield of 8.04% and a five-year annualized NAV return of 7.78%.
Higher distributions are not automatically higher economic return. JEPI's option income can soften volatility and support cash payments, but it can also surrender some upside during strong equity rallies. DVY offers more direct participation in its dividend-stock portfolio and can be more sensitive to sector concentration and value-stock cycles.
Taxes can widen the practical difference. JEPI distributions may include income with different tax treatment from qualified stock dividends, while selling either fund can realize capital gains. Account type and an investor's own tax situation therefore matter as much as the headline yield.
JEPI launched in May 2020, so a clean ten-year comparison does not exist. The available history shows a trade-off, not a universal winner: DVY compounded more over the measured five-year window, while JEPI delivered much more current income. Investors should choose the return pattern they need rather than treating the largest distribution as the largest return.
JEPI's Monthly Reinvestment Can Complicate Tax-Loss Harvesting

JEPI's monthly distributions can complicate tax-loss harvesting when automatic reinvestment is active in a taxable account. The issue is not the payment itself. It is the purchase of additional JEPI shares inside the wash-sale window.
IRS Publication 550 says a wash sale can occur when an investor sells securities at a loss and buys substantially identical securities within 30 days before or after the sale. A dividend reinvestment purchases more shares of the same fund, so it can meet that condition.
The effect is usually partial rather than all-or-nothing. If a reinvestment buys fewer shares than the investor sold, the IRS matching rules apply the wash-sale treatment to the corresponding number of shares. The remaining sold shares may still generate a currently deductible loss, subject to the investor's broader tax circumstances.
The source used JEPI's October distribution to illustrate the scale. A distribution of $0.34134 per share reinvested near $57.12 would purchase shares equal to roughly 0.598% of the original position. More than one monthly purchase can fall inside the 61-day period surrounding a sale, so the affected slice can be larger.
A disallowed loss is generally added to the basis of the replacement shares, and the holding period carries over. That defers the deduction until those replacement shares are sold and creates additional recordkeeping. Investors should rely on their broker's records but still verify lots, because accounts at different brokers or an IRA purchase can complicate reporting.
The practical precaution is to turn off automatic reinvestment before a planned harvest and keep it off through the relevant window, while checking actual trade and reinvestment dates. Simply selling midway between monthly payments may not create enough distance on both sides.
This issue matters only when shares are sold at a loss in a taxable account. It does not make JEPI's monthly distribution policy defective, and tax-loss harvesting may not be suitable for every investor. Because wash-sale rules are fact-specific, investors with multiple accounts or large deductions should consult a qualified tax professional.
Halliburton Sees 15% Margins Without a Fracking Recovery
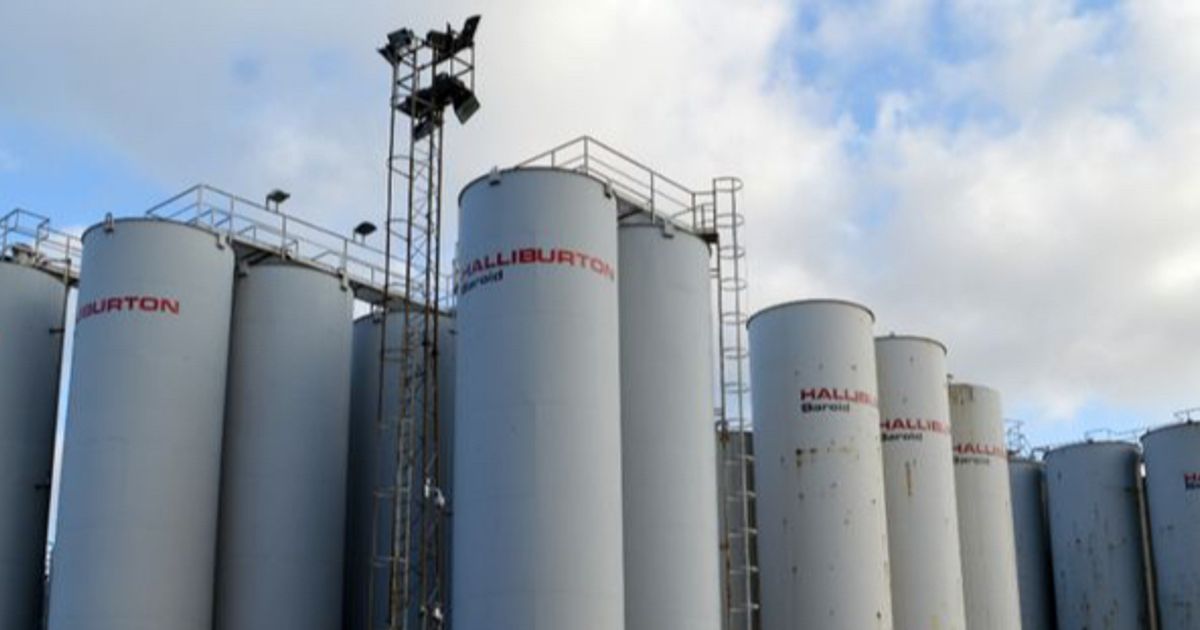
Halliburton's early 2027 outlook rests on an unusually important assumption: the company does not need a recovery in North American hydraulic fracturing to reach its target. Management expects mid-single-digit revenue growth and an operating margin of about 15%, roughly two percentage points above its current outlook.
The third quarter showed why that mix shift matters. Revenue was $5.7 billion, broadly unchanged from the second quarter. North American revenue fell 5% to $2.2 billion, primarily because of weaker pressure-pumping activity. International revenue rose 3% to $3.5 billion, including an 8% increase in the Middle East and Asia to $1.4 billion.
Segment results reinforced the contrast. Drilling and Evaluation revenue increased 4% to $2.6 billion, while operating income rose 16% to $391 million. Completion and Production revenue declined 4% to $3.1 billion, and operating income fell 4% to $457 million as stimulation activity weakened in the Western Hemisphere.
Reported and adjusted results also moved in different directions. Net income attributable to Halliburton fell to $417 million from $534 million in the second quarter. Adjusted net income rose to $501 million from $461 million, and adjusted earnings per share increased to $0.60 from $0.55.
The difference reflects $107 million of pre-tax charges, mainly severance costs from a global restructuring and inventory write-downs. Investors should not ignore those costs, but the adjusted improvement suggests the underlying business performed better than the reported decline alone implies.
Cash conversion remains a near-term watchpoint. Operating cash flow was $368 million and free cash flow was $156 million, while share repurchases totaled about $250 million. That means buybacks exceeded quarterly free cash flow.
The 2027 margin target is credible only if international growth continues, restructuring savings appear and North American pressure pumping does not deteriorate further. A flat fracking market may be enough for management's plan, but a deeper decline would test the claim that international activity can carry the whole improvement.
Latest comments